Report Center User Guide
Getting started with the Report Center
Creating a new dashboard
- On the Navigation bar, select Bot/Report Center to view available dashboards.

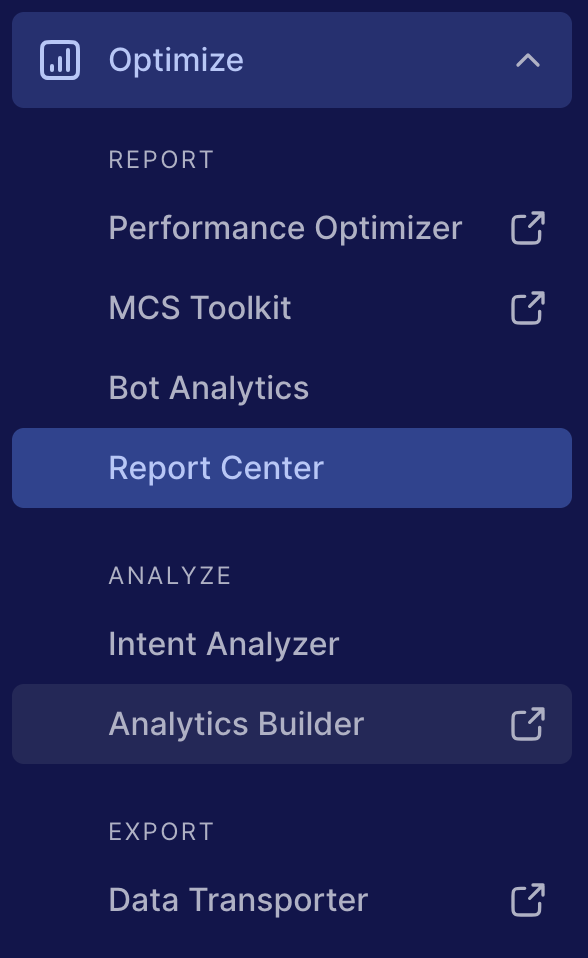
RC: Navigation Bar
2. Click on the Plus


RC2
icon next to the dashboard header.
3. Select a pre-populated template for use or start from a blank report.

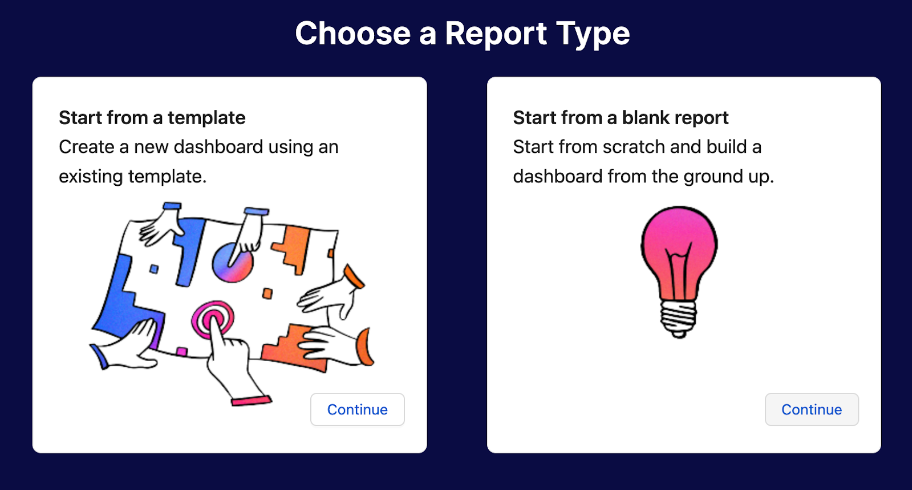
RC3
4. Add a name for your dashboards and save.
Edit a dashboard and use filters
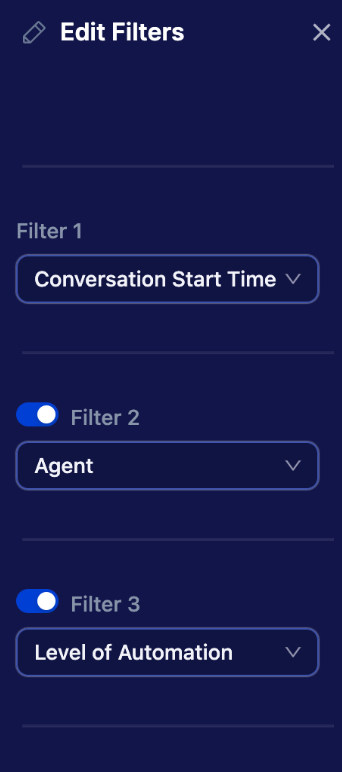
1. To filter data in any dashboard; Select the dashboard and click on the Filter button.

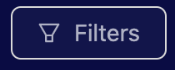
RC4
2. A drop down menu will appear on the right side of your screen. Select your needed filters. You can use the toggle functionality (Filter 1 & Filter 2) to choose two filters as per your needs.

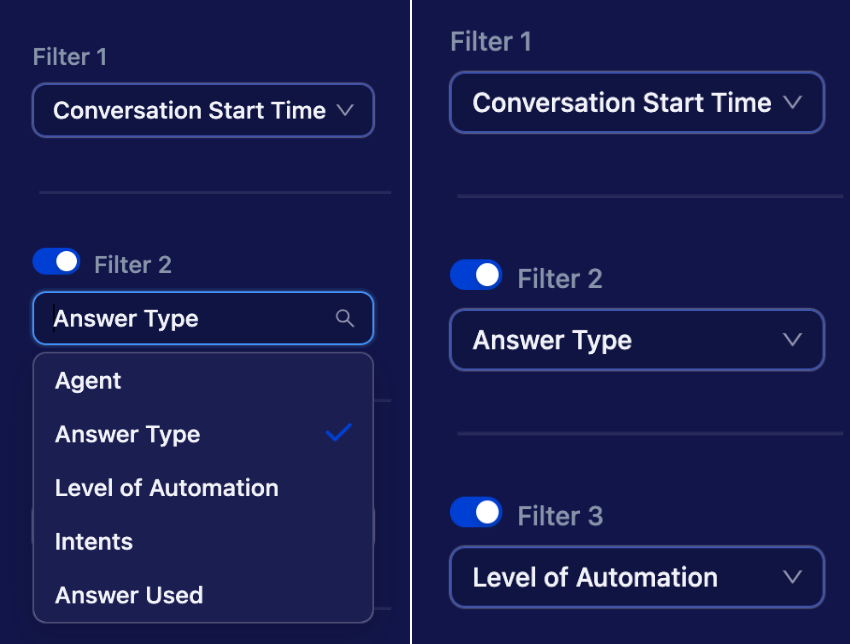
RC5
3. To Edit the dashboard, click the Pencil


RC6
icon on the top right corner of the dashboard.
4. Once in a dashboard Edit Mode, use the Edit button on a chart to select metrics.

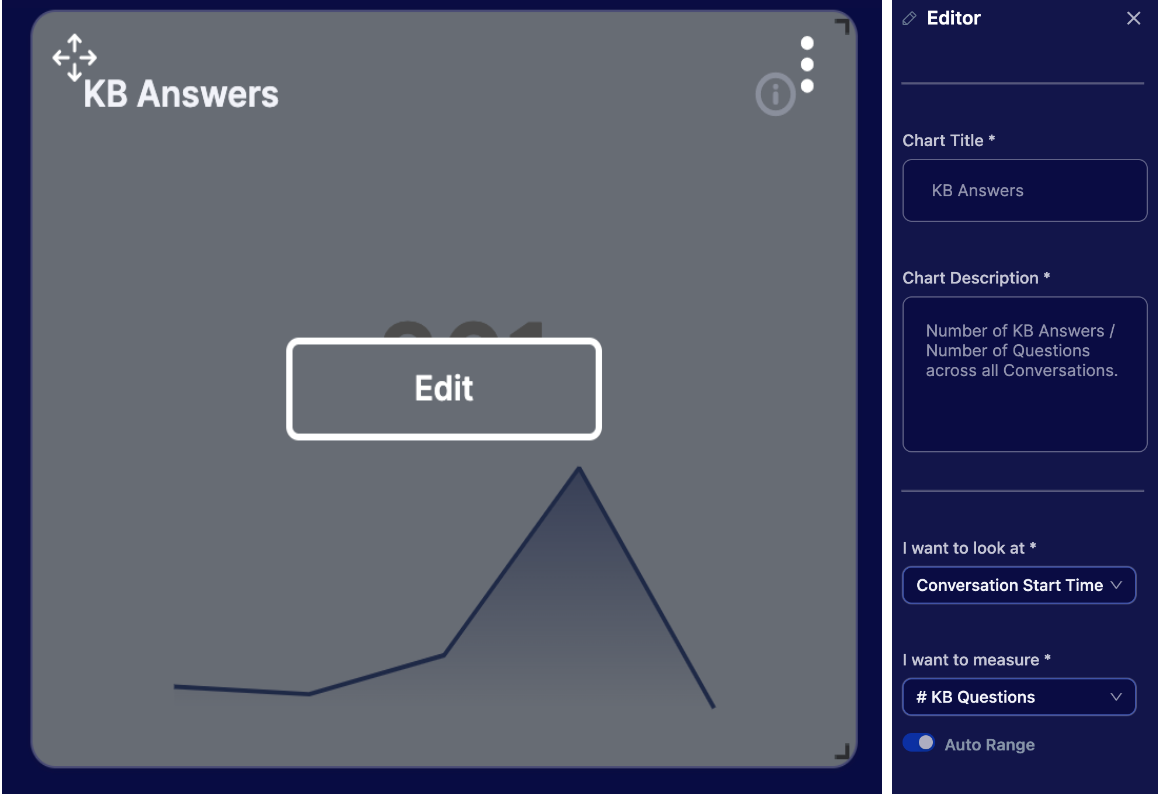
RC7
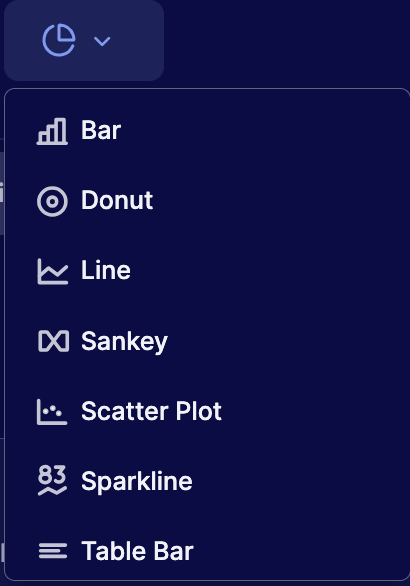
5. On an Edit Mode, click the Create New Chart drop down menu on the left hand corner of the dashboard. Use required charts from the drop down menu as per your need.

6. You can also use the filter/time option provided on top of a dashboard to select the provided filter and timeframe.

RC8
Transcript Viewer
1. Click on the Conversation


button on the top right corner of the dashboard.
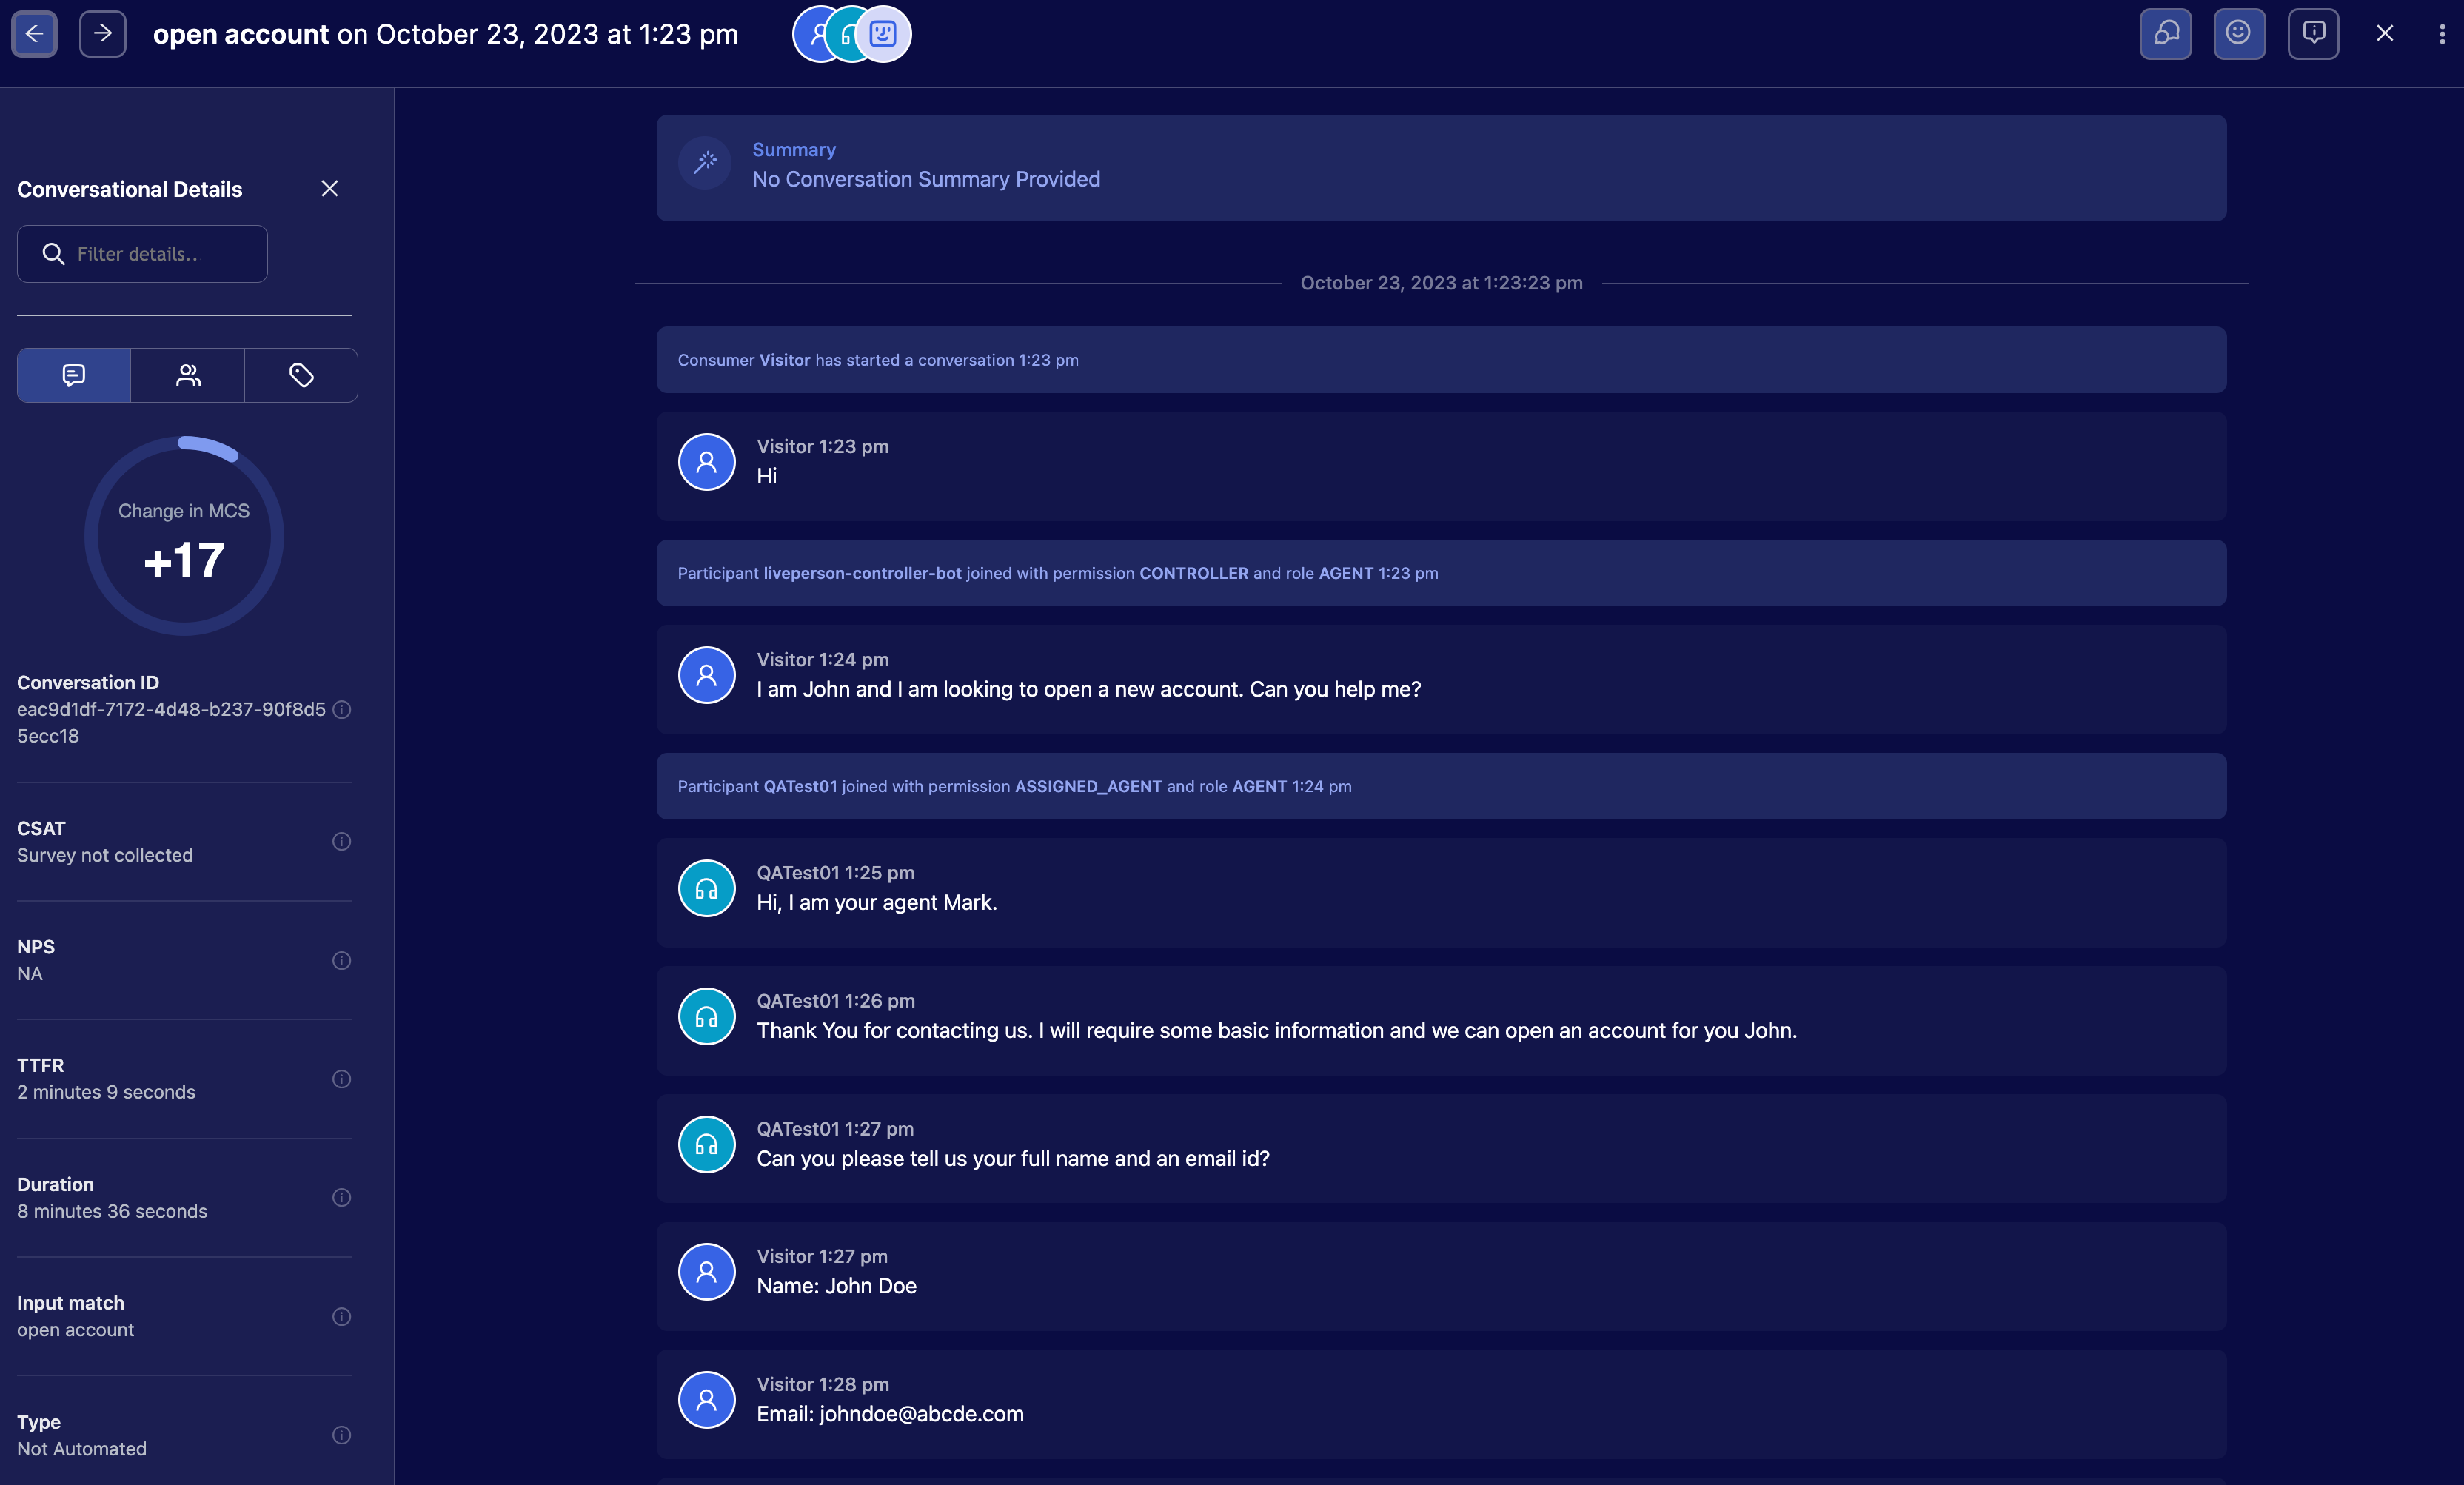
2. A conversation list opens up in the dashboard. Conversation list is per conversationId and the associated metrics.
3. Click on a conversation list, this opens up the transcript associated to a conversationId. Find below the Transcript Viewer.

Keyword Search
- A feature to search transcripts with keyword is available for use. Please look at the demonstration provided below.
Data Transporter integration with Report Center
- A demonstration for access is available below. Access to the integration is provided to admins and agent managers who have three permissions enabled.
a. Data Transporter: access enabled
b. Data Transporter: view and download history
c. Data Transporter: manage tasks - Limits on RC and DT export:
a. It is not possible to download files after 28 days of creation
b. No limit on "Just Once" task creation
c. Each user is limited to just view their own created task - A demonstration on the use of the data transporter is included below.
Understanding Metrics
When using the Report Center, you can incorporate a variety of metrics and dimensions to gain valuable insights for the use case you're analyzing
Here is the metrics and dimensions list that can be considered while creating your dashboard and charts.
FAQ
Which roles have access to the Report Center?
Report Center has two models called conversation and engagement controller.
| User Role | Access to Report Center | Access to Conversations | Create Dashboards |
| LPA | Yes | No | Yes |
| Administrator | Yes | No | Yes - only Engagement Controller Reports |
| Agent Manager | Yes | Yes | Yes |
| Campaign Manager | Yes | No | Yes - only Engagement Controller Reports |
Missing Something?
Check out our Developer Center for more in-depth documentation. Please share your documentation feedback with us using the feedback button. We'd be happy to hear from you.