Report Center Overview
Introduction
The Report Center represents our vision to streamline the diverse landscape of analytics and reporting across various products into a unified framework within the Conversational Cloud. We aim to encompass critical aspects such as sentiments, intents, operations, bots, generative AI, and voice analytics. LivePerson is poised to set industry standards by developing analytics that not only provide insights but also drive actionable outcomes.
In the coming months, we envision the following developments:
Report Center's Agility: The Report Center will evolve into a versatile and adaptable source of truth. It will swiftly accommodate new AI product releases from LivePerson, ensuring it remains up-to-date and lightweight.
Eliminating Fragmentation: Our current reporting options can be fragmented and lack a clear framework for users to navigate. This has led to confusion as multiple systems offer varying definitions of similar metrics. Our aim is to simplify this landscape, providing a cohesive and user-friendly experience that eliminates confusion and frustration for our valued customers.
The Report Center is set to revolutionize how you access and utilize analytics, bringing clarity, consistency, and actionable insights to the forefront of your Conversational Cloud experience.
Goal
- Consolidate metrics present in MCS toolkit which are currently used by brands into Report Center.
- Utilize LP metrics to provide meaningful insights into performance/operations. Break down business goals into granular fact based data which can be used to answer broader business questions and goals.
- Surface Transcript Viewer to provide customers an easy and efficient access to conversation data.
UI Mockup below shows the basic navigation and look of Report Center

New nav bar mockup UI
Features
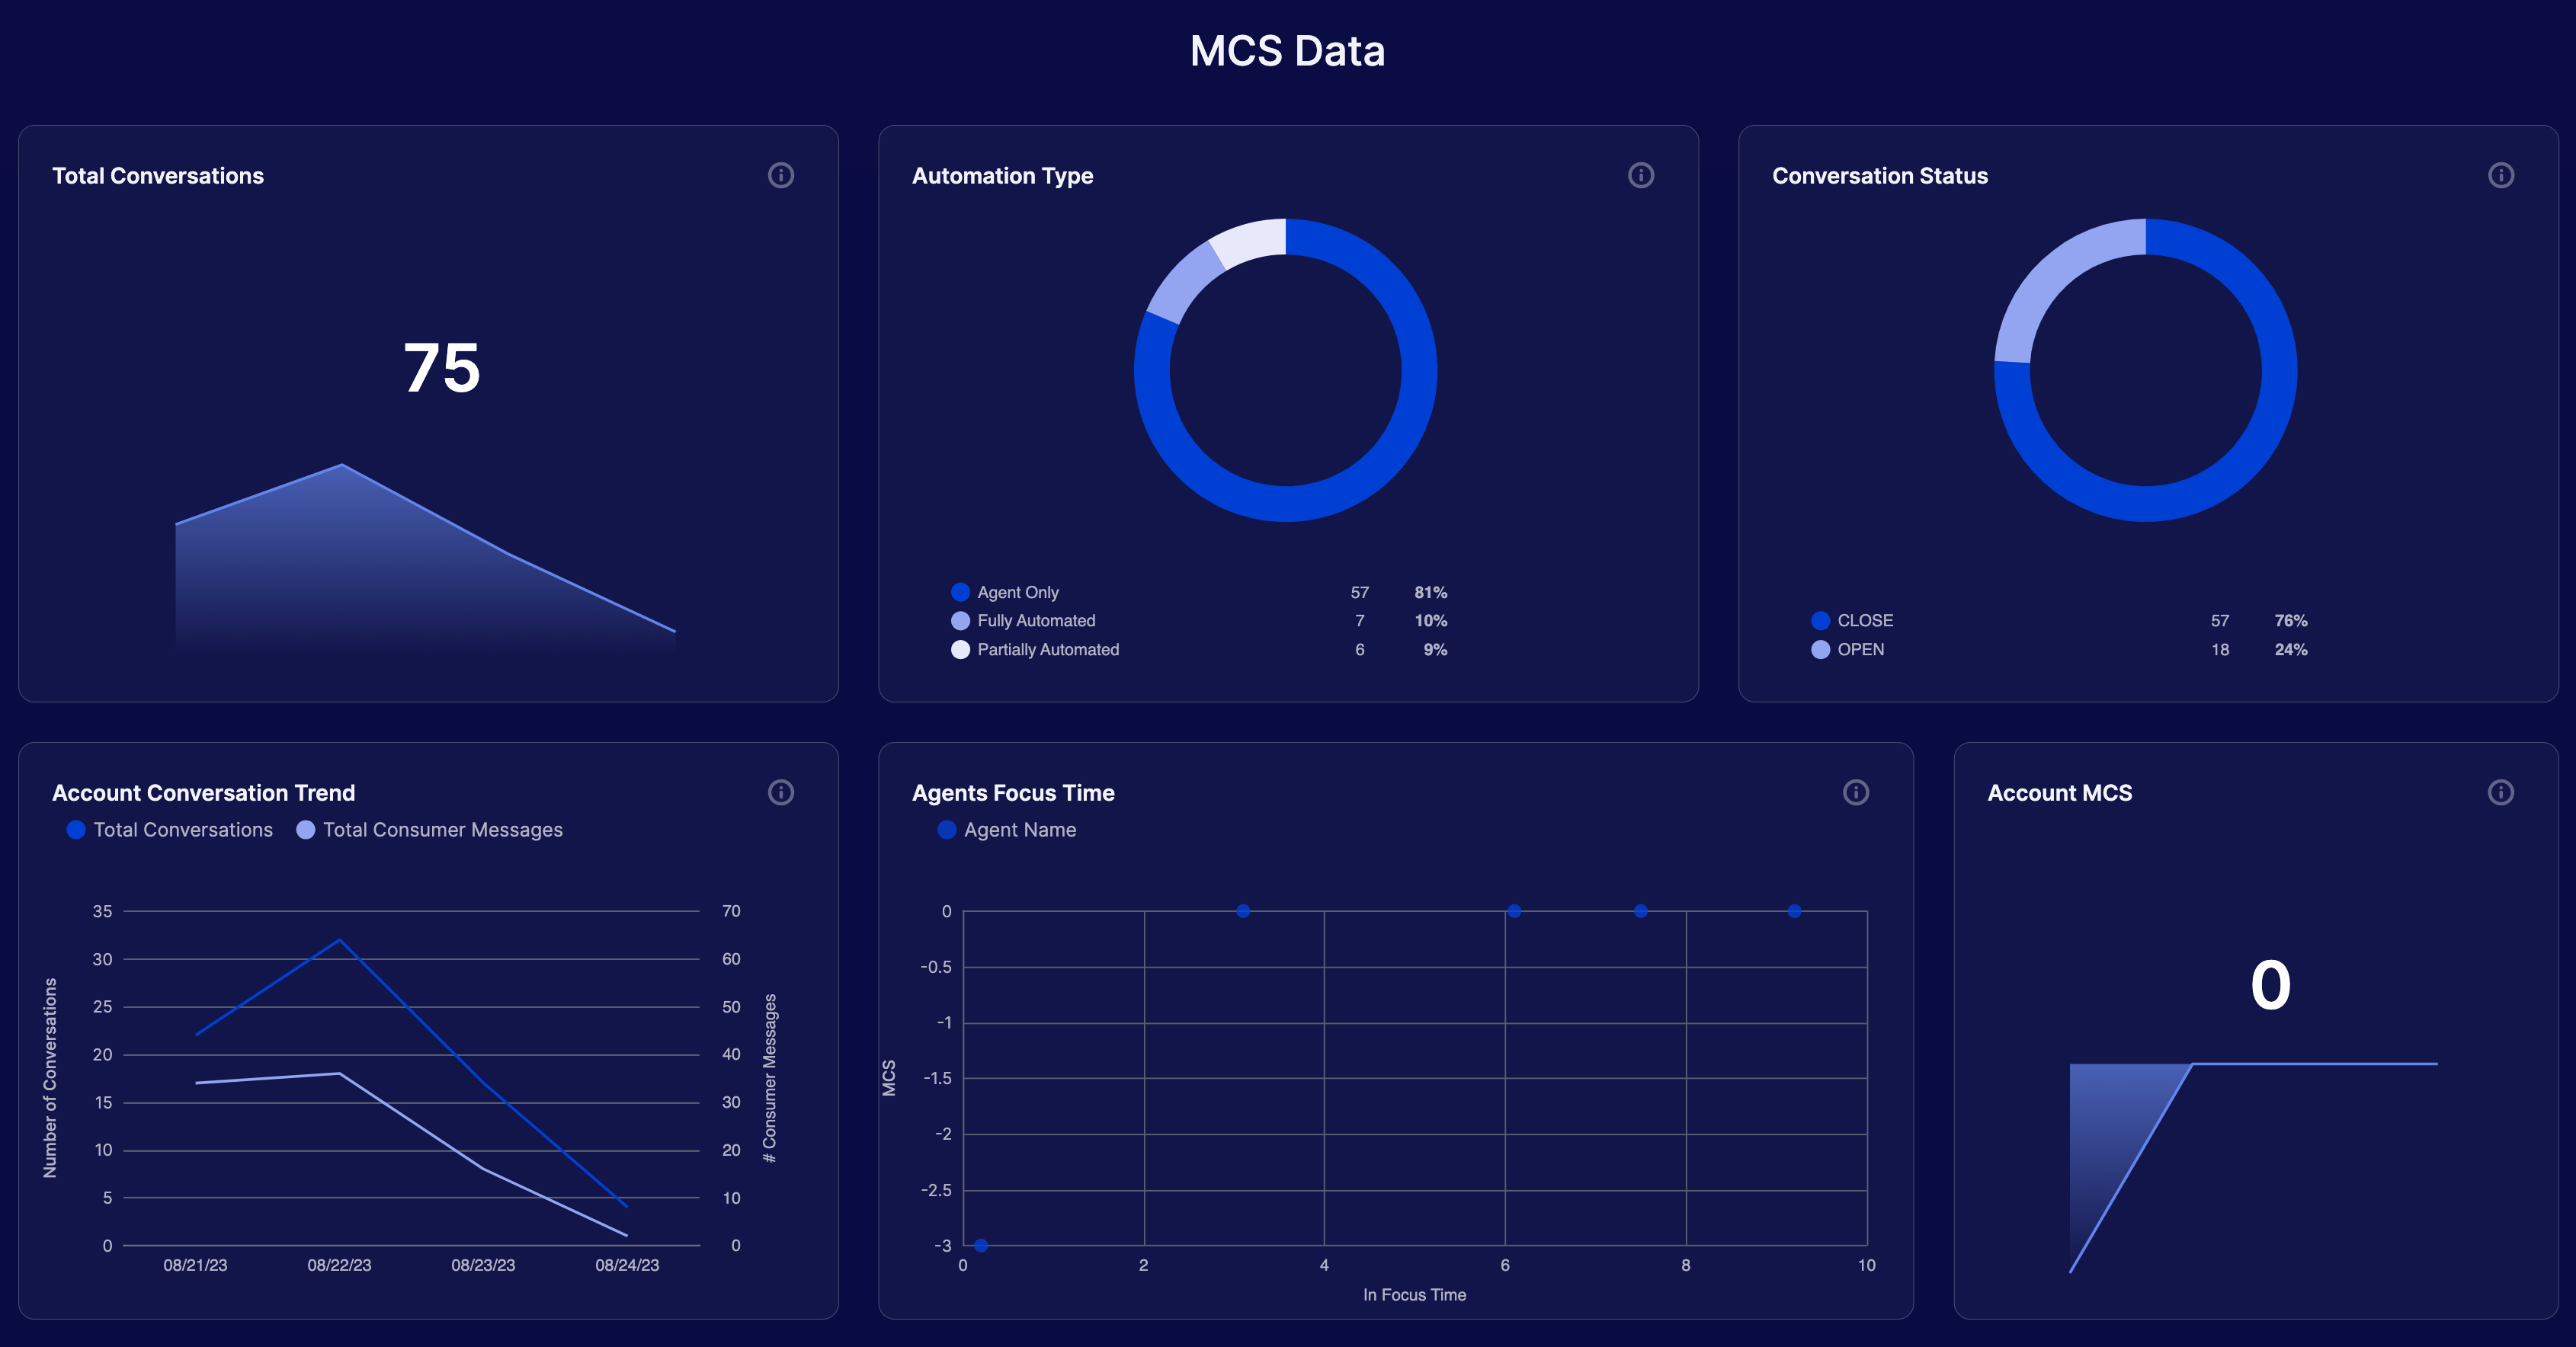
The above product UI shows the Report Center, a drill-down to the transcript, and an initial set of functionality that lets a user configure dates and views.
Navigation – User selects “Report Center” from the (new) Conversational Cloud NavBar and can choose a view between agent, bot, consumer, and operations.
- Chart Types – Table bar, dot plot, table, scatter plot, sankey, tornado, gauge, sparkline, donut, line, bar, heatmap.
- Filters + Date Ranges – Allow brands to choose from a list of set date ranges of the last 13 month
- Editing – Allow brands to swap metrics-for-metrics and dimensions-for-dimensions.
- Drill-down to conversation – Transcript Viewer
- User Roles - Administrator
FAQs
Will I see MCS and conversation data on the Report Center?
Yes, you will be able to see MCS, conversation metrics, and transcripts on the Report Center.
How can I gain access to Report Center?
You should be able to gain access to the reporting system via your navigation bar as shown in the UI mockup above. To enable Report Center for your account, you would have to request access and enable an AC Feature.
Missing Something?
Check out our Developer Center for more in-depth documentation. Please share your documentation feedback with us using the feedback button. We'd be happy to hear from you.