Survey dashboard for live chat
Capture all responses to surveys presented to agents and consumers in your Live Chat implementation. This dashboard supports dynamic drilling down into specific survey questions and their respective responses, including a dedicated predefined visualization for analyzing CSAT trends.
Primary datasets: survey forms and answers
Minimum timeframe: daily
Primary filters:
- Survey type / form, and question
- Agent, agent group, and skill
Main panel: survey analysis
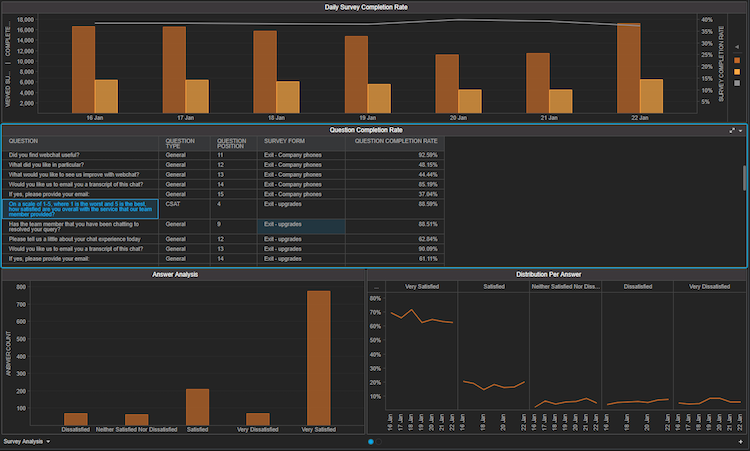
This panel consists of an interconnected set of visualizations allowing for a drill down form the survey form level down to an analysis of distribution of responses for a specific survey question. Click through from top to bottom to follow the analysis path.

| Graph Name (Type) | Vertical / Angle (Metrics) | Horizontal / Color (Attributes) | Additional functions |
| Daily Survey Completion Rate(combined bar and line chart) | VIEWED SURVEY(bar chart),COMPLETED SURVEY(bar chart),SURVEY COMPLETION RATE(line chart - right axis) | DATE | Hover over bars display popup:DATEVIEWED SURVEY or COMPLETED SURVEY |
| Question Completion Rate(grid) | QUESTION COMPLETION RATE | QUESTION, SURVEY FORM | Dynamically populates the “Answer Analysis” bar chart, and the “CSAT Analysis” line chart (if the question if of type CSAT). |
| Answer Analysis(bar chart) | ANSWER COUNT | ANSWER | Dynamically populates the “Distribution per answer” line chart.Deselecting an answer will show the distribution for all answers of the selected question, side by side. |
| Distribution per Answer(line chart) | ANSWER RATE | DATE, ANSWER | Hover over live displays popup:ANSWERDATEANSWER RATE |
Image 1: survey activity main panel
Second panel: CSAT analysis
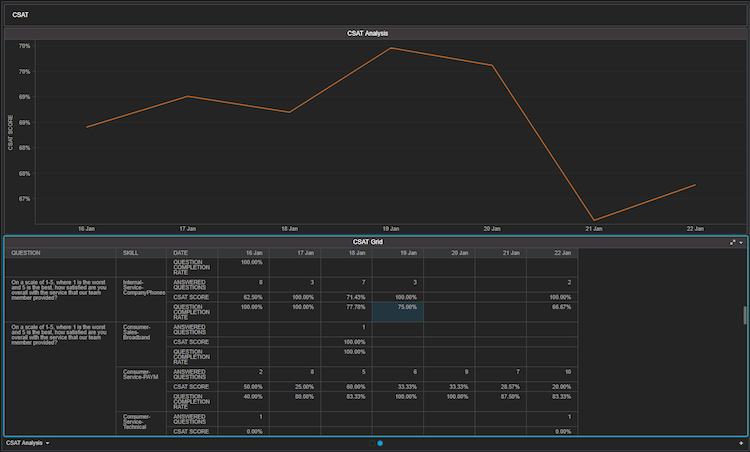
This panel displays the trend of CSAT score over the selected time frame. The grid will drill down to show the CSAT scoring by survey question at the skill level per day.

CSAT Grid
Row (attributes)
- Question
- Skill
Row (Metrics)
- Answered Questions
- CSAT Score
- Question completion rate
Columns (attributes)
- Date
Main panel: Survey activity question grid
Export daily survey responses with a full distribution of the provided answers. This ready made grid captures the survey responses per skill and agent to support additional offline manipulations over the available granularity.
Detailed Analysis (Grid)
Rows (attributes):
- DATE
- DAY OF WEEK
- GROUP
- SKILL
- AGENT
- SURVEY TYPE
- SURVEY FORM
- QUESTION
- QUESTION REQUIRED INDICATOR
- QUESTION TYPE
- ANSWER
- ANSWER TYPE
- STRUCTURED ANSWER INDICATOR
Columns (metrics):
- ANSWER COUNT
- ANSWER RATE
Second panel: survey form grid
Export a high level overview of the survey forms to analyze the display and completion rates.
Survey analysis (grid)
Rows (attributes):
- DATE
- DAY OF WEEK
- SURVEY TYPE
- SURVEY FORM
Columns (metrics):
- VIEWED SURVEY
- COMPLETED SURVEY
- SURVEY COMPLETION RATE
This dashboard is also available in BI
Predefined grid
The grid spreads out all the relevant metrics in a granular view so any member on the account may easily download the grid or receive scheduled copies to their email.
Perform the analysis and customization you need using an offline copy, in excel using the complete grid. You can choose the document type (daily/monthly) based on your needed timeframe. The daily grid gives daily aggregations for all the metrics while the monthly grid offers the corresponding aggregations at the monthly level. The data is presented at the brand, campaign and engagement level.
Metrics
For all metrics available within this dashboard please search the Analytics Builder Data Metrics by the name of the dashboard in the Developer Center.

Missing Something?
Check out our Developer Center for more in-depth documentation. Please share your documentation feedback with us using the feedback button. We'd be happy to hear from you.