Business dashboard and grid for live chat
The Business Activity predefined dashboard provides a daily snapshot of campaign performance, allowing brands to analyze the campaign funnel, including both chat and Web Messaging engagements. Using this dashboard, you can identify opportunities to grow your reach and boost service availability by extracting actionable conclusions based on the consumer’s journey through the brand website, and other engagement sources. This dashboard reflects consumer demand as well as how successfully the campaign was set up on the account. You can utilize this dashboard to optimize your campaign targeting and engagement routing.
Operational metrics for agent productivity and utilization have been added to compliment the funnel metrics. These operational metrics can be viewed alongside the funnel data but cannot be streamlined into one filterable view, as the dashboard does not include skill level analysis.
Primary datasets: engagement exposures, viewed and accepted engagement offers, conversions
Primary filters:
- Initial device: desktop/laptop, mobile smartphone, mobile tablet
- Goal type: based on campaign goals, such as “Sell product/service”
- Goal: set up on the account’s campaigns
- Conversation type: chat or messaging
- Source Type: Web, Brand App, Twilio SMS, Facebook, Apple Messages for Business, Google, Line
Minimum time frame: Daily
Understanding funnel metrics (aggregation levels and distinct counting)
Aggregation Levels
The business funnel can be analyzed from several different aspects. The Business Activity dashboard offers a view into 4 of these: Site, Line of Business, Campaign, and Engagement. At each level, the metrics included in the business funnel are pre-aggregated to reflect the corresponding aspect.
A suffix has been added to each metric name to allow users to identify the level to which the metric is pre-aggregated. For example: “PROSPECTS (CAMP)” and “EXPOSED (LOB)”.
Important to note that the funnel is aligned to the Visit session start time. This means that the date filter set on the dashboard applies to all visits starting within the selected range, including the events which occurred for the entire duration of the retrieved visit sessions.
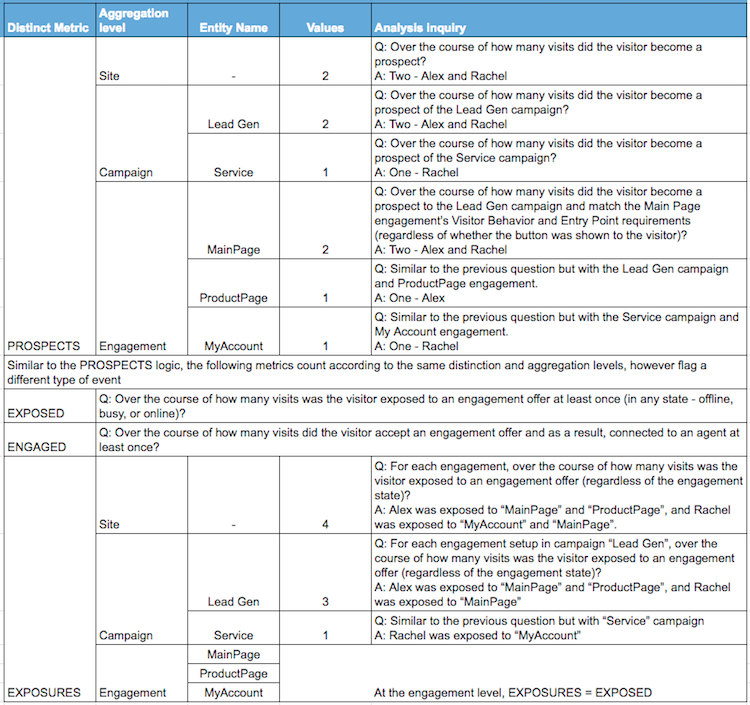
Distinct metrics
Each funnel metric is assigned to a distinct level, which indicates the consumer experience. There are two distinct levels in the Business Activity dashboard: visitor-session and engagement.
- Distinct per visitor session will add 1 to the metric results when a defined event occurred during the visit.
- Distinct per engagement will add 1 to the metric results when a visitor was exposed to a specific engagement. The following list contains the distinct metrics and their underlying formula (where applicable): Distinct to visit
- PROSPECTS - Number of visits that were eligible to receive at least one engagement. Includes control group visitors if defined in the account
- EXPOSED -Number of visits during which the visitor was offered an engagement
- ENGAGED - Number of visitors who had at least one engagement during their visit Distinct to Engagement
- EXPOSURES - Number of times each engagement was offered to a visitor
- CHAT BUSY EXPOSURES - Number of times each engagement was offered to a visitor in busy state
- CHAT OFFLINE EXPOSURES - Number of times each engagement was offered to a visitor in offline state
- CHAT ONLINE EXPOSURES - Number of times each engagement was offered to a visitor in online state
- CONTENT EXPOSURES - Number of times each content engagement was offered to a visitor
- MESSAGING EXPOSURES - Number of times each Web Messaging engagement was offered to a visitor For example:
The following campaign setup is given:

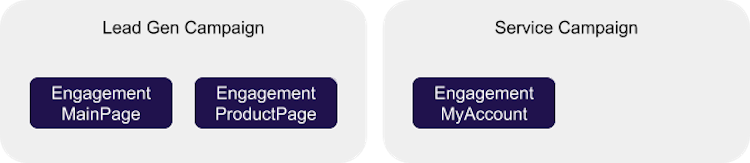
Visitor Alex is a prospect for the “Lead Gen” campaign, and during his visit, he sees the following:
- Offline “MainPage” button
- Online “MainPage” button after moving to another page in the same section
- Online “ProductPage” button
Alex clicked the “ProductPage” button and conversed with an agent.
Visitor Rachel is a prospect for the “Lead Gen” and “Service” campaign during the same visit. She sees the following:
- Online “MyAccount” button
- Offline “MainPage” button
Rachel self served (meaning she did not converse with an agent during her visit).
Here are the results observed in the Business Activity dashboard per each distinct metric in each pre-aggregated level:

Main sheet: Business activity analysis
Corresponding to the aggregation levels presented in the above section, the predefined main sheet of the Business Activity predefined dashboard contains a panel for each aggregation level. Since the panels are identical in metrics and attributes, the following section outlines the common list of metrics, followed by the additional functionality at the relevant level.
Common to all panels
There are four available panels in this dashboard: Site, LoB, Campaign, and Engagement. In each panel, the following visualizations are in common.


Top data bar (Grid)
Columns (Metrics):
- PROSPECTS
- EXPOSED
- ENGAGED
- ENGAGEMENTS
- TOTAL GOALS REACHED AFTER ENGAGEMENT
- TOTAL CONVERSIONS AFTER ENGAGEMENT
| Graph Name (Type) | Vertical (Metrics) | Horizontal (Attributes) |
| Prospects(bar chart - main axis) | PROSPECTS | WEEK |
| Exposed | EXPOSED(bar chart - main axis) | WEEK |
| EXPOSED RATE(line chart - secondary axis) | N/A | WEEK |
| Engaged | ENGAGED(bar chart - main axis) | WEEK |
| ENGAGED RATE(line chart - secondary axis) | N/A | WEEK |
| Conversions | TOTAL CONVERSIONS AFTER ENGAGEMENT(bar chart - main axis) | WEEK |
| INCREMENTAL CONVERSION RATIO(line chart - secondary axis) | N/A | WEEK |
Trend (Grid)
Rows (Attributes): WEEK, Total, Average
Columns (Metrics):
Funnel metrics
- PROSPECTS
- EXPOSED
- EXPOSED RATE
- EXPOSURES
- AVG. EXPOSURES
- CHAT ONLINE EXPOSURES
- CHAT ONLINE EXPOSURE RATE
- ENGAGEMENT VIEWS
- ACCEPTED OFFERS
- CHAT ACCEPTED RATE (ENG)
- REQUESTED CHATS
- CONNECTED CHATS
- CONNECTED CHAT RATE (REQUESTED)
- CONNECTED ENG. RATE (ACCEPTED)
- ENGAGED
- ENGAGED RATE
- ENGAGEMENTS
- INTERACTIVE CHAT RATE
Goals metrics
- TOTAL GOALS REACHED AFTER ENGAGEMENT
- TOTAL GOAL REACHED RATE AFTER ENGAGEMENT
- TOTAL CONVERSIONS AFTER ENGAGEMENT
- TOTAL CONVERSION RATE AFTER ENGAGEMENT
- TOTAL CONVERSION RATE AFTER EXPOSURE NOT ENGAGEMENT
- INCREMENTAL CONVERSIONS
- INCREMENTAL CONVERSION RATIO
- Operation metrics
- CUMULATIVE ENGAGED CHAT TIME
- AVG. CHAT LENGTH
- AVG. INTERACTIVE CHAT LENGTH
- AVG. NON - INTERACTIVE CHAT LENGTH
- AVG. TIME TO ANSWER CHAT
- MAX. TIME TO ANSWER CHAT
Common to LoB, campaign, entry point and engagement panels
In order to isolate filtering by a specific object name to a single panel without influencing the other panels, a search box has been added to each panel. Searching and selecting one or more Lines of Business, Campaigns, Engagements, or Entry Points (each in their respective panel), will filter all the visualizations in the panel. This will allow drill down to the performance of a designated group of object (for example: all Sales related LoBs).
Each panel, in the bottom area, includes the general volume generated by each LoB, Campaign, or Engagement.
| Graph Name (Type) | Vertical (Metrics) | Horizontal (Attributes) |
| [Object] Name(bar chart) | PROSPECTS, ENGAGEMENTS | LINE OF BUSINESS / CAMPAIGN / ENGAGEMENT |
Site panel
The site level analysis adds to the top of the funnel an overview of web-traffic including the following additions.
| Graph Name (Type) | Vertical (Metrics) | Horizontal (Attributes) |
| Prospects | PROSPECT RATE(line chart - secondary axis) | WEEK |
Top data bar (Grid)
Columns (Metrics):
- SESSIONS
- LOGGED IN TIME
Site Trend (Grid)
Columns (Metrics):
Funnel metrics
- SESSIONS
Operation metrics
- LOGGED IN TIME
- AWAY TOTAL NOT ENG.
- AWAT TOTAL NO ENG. RATE
- LABOR TIME
- AWAY TOTAL ENG.
- AWAY TOTAL ENG. RATE
- ENGAGED TIME
- ENGAGED TIME RATE
- OCCUPANCY RATE
- CONC. ENGAGED
- CONC. LABOR
Engagement panel
Included in this panel is an engagement formats selector, allowing the filtering of all data presented in this panel by the format as set up in the engagement entity in the Conversational Cloud campaign module.
Supported formats include:
- Embedded
- Sticky
- Overlay
- Toaster
- Slide-out
- Peeling corner
Entry point panel
The Entry Point is a section on your website. On each entry point, setup in a campaign, consumers are targeted and engaged. As your Conversational Cloud implementation grows, consumers arriving to an Entry Point may be targeted by several campaigns, effectively competing with each other towards the same or even different business goals.
Use the Business Activity by Entry Point to analyze the traffic on each website section. Are your campaigns covering all the visit sessions to this entry point? Are prospects being offered an engagement. Take the opportunity to optimize your targeting and engage with enough and the right consumers.
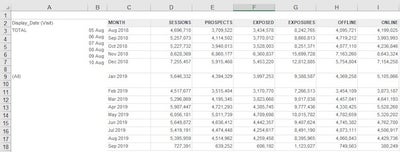
Business activity grid
The business activity grid spreads out all the funnel metrics in a granular view so any member on the account may receive scheduled copies to their email.
Perform the analysis and customization you need using an offline copy, in excel using the complete business activity grid. You can choose the document type (daily/monthly) based on your needed timeframe. The daily grid gives daily aggregations for all the metrics while the monthly grid offers the corresponding aggregations at the monthly level. The data is presented at the brand, campaign and engagement level.
Predefined grid
The grid spreads out all the relevant metrics in a granular view so any member on the account may easily download the grid or receive scheduled copies to their email.
Perform the analysis and customization you need using an offline copy, in excel using the complete grid. You can choose the document type (daily/monthly) based on your needed timeframe. The daily grid gives daily aggregations for all the metrics while the monthly grid offers the corresponding aggregations at the monthly level. The data is presented at the brand, campaign and engagement level.
For all metrics available within this dashboard please search the Analytics Builder Data Metrics table by the name of the dashboard here.
Missing Something?
Check out our Developer Center for more in-depth documentation. Please share your documentation feedback with us using the feedback button. We'd be happy to hear from you.