Real time data for chat
As an agent manager, you want to have an overall picture of how your agents are performing at any given time. The data bar provides you with a snapshot of the basic information you need to track agent efficiency and operational performance.
The data bar default view presents aggregated data from all skills (queues) on the account for the last 12 hours.
Agent real time data bar
The agent data bar enables agents to monitor their own performance data in real time. The agent data bar is displayed above the web visitors list.

As an agent, you have goals to meet, such as achieving a specific customer satisfaction rate or a certain number of engagements per hour.
The data bar displays the following metrics:
Engagements
Engagements represents the number of chats you’ve taken during your current shift. The system counts the chat once you close the Engagement window.
Average engagement length
The length of your chats varies depending on the type of inquiries you receive. Your chats should be only as long as they need to be to ensure successful resolution of your customer’s issue:
Note:
Average engagement length = Total concurrent engaged time / number of interactive engagements
For example, if you were engaged for a total of 5 hours (including concurrent chats) and in that time took five chats, your average engagement length is: 5 hours / 5 = 1 hour
Engagements per hour
Note:
Engagements per hour = The number of interactive engagements / online time + away time engaged + back soon time engaged
For example, if you took six (6) engagements between 8 a.m. and 11 a.m. (and you were online during this period of time), your engagements per hour:
6 engagements / 3 hours = 2 engagements per hour
Utilized capacity
Utilized Capacity is calculated as follows:
Utilized capacity = total concurrent engaged time / total logged in the X maximum allowed concurrent chats
4.5 / 5x4 = 22.5 => 22.5%
If your utilized capacity is low, then either you are not busy enough, or the volume of chats has decreased. If, on the other hand, your utilized capacity is high, you are fully occupied.
CSAT
This score reflects your customers’ rating of your engagement with them. The data is collected from customers in the post-chat survey. By reading your CSAT score, you can see if you need to improve your chatting skills. You can get guidance and help from your manager and your peers.
CSAT = Total number of positive answers / total number of answers
Monitor your data bar, to make sure that you are meeting your goals. If your utilization and CSAT scores are below par, get help from your manager or your peers.
You can also monitor performance with the Agent Dashboard.
Agent real time dashboard
The agent dashboard provides additional detailed and graphical information about agent performance. To access the agent dashboard, click the pull-down button above the web visitors list.


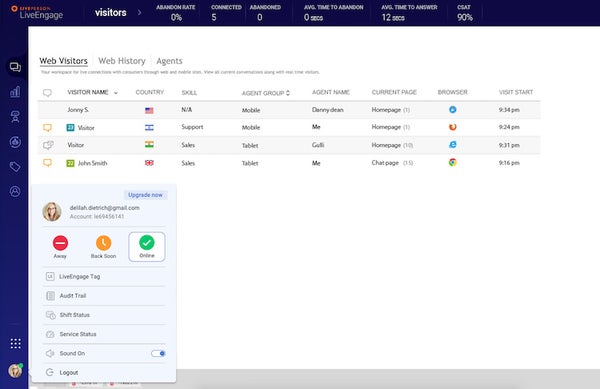
Queue health data bar
The queue health data bar provides a snapshot of the basic information required to track agent efficiency and operational efficiency. The queue health data bar is located above the web visitors list.


The data bar default view presents aggregated data from all skills (queues) on the account for the last 12 hours.
Metrics
CONNECTED: displays the number of connected chats between visitors and agents whether or not they interacted.
ABANDONED: displays the number of visitors that left the queue before connecting to an agent. Visitors abandon the queue for a number of reasons; they might just get tired of waiting.
ABANDON RATE: displays the percentage of visitors that abandoned the queue out of all visitors that entered the queue. Abandon rates should not exceed 5%.
AVG TIME TO ABANDON: displays the average time from the moment visitors enter the queue until they abandon it. Although you don’t have control over this number, it is useful for you to know the average length of time it’s taking for visitors to abandon the queue, so you can take action.
AVG TIME TO ANSWER: displays the average time from the moment that visitors enter the queue to the moment they connect with agents. As a rule of thumb, a good average time to answer is between 15 and 30 seconds. If the average time to answer is longer than 30 seconds, for example at peak hours, you may want to consider adding agents to this shift.
According to the data in the data bar, you can offer your agents constructive feedback to help shorten the average time to answer chats and lower the abandon rate, and adjust your staffing accordingly.
Queue health dashboard (24 hours)
The queue health dashboard graphically displays real-time and historical data that enables easily evaluation of agent efficiency. To access the queue health dashboard, click the pull-down button above the web visitors list.

Agent list data bar
The agent list enables agent managers to track agent status in real time, including the availability and concurrency of agents.
The agent list data bar is located above the list of agents.


Missing Something?
Check out our Developer Center for more in-depth documentation. Please share your documentation feedback with us using the feedback button. We'd be happy to hear from you.