Skills dashboard for live chat
This dashboard includes metrics used to analyze skill queue performance. This dashboard also entails hour offset capabilities allowing users to show the data with an offset to match the time zone where they manage their operation.
Primary datasets: Queue health, engagements, surveys
Primary filters: Skill, agent group
Minimum timeframe: Hourly
Main panel: skills dashboard
The following panel will be presented when accessing the skills predefined dashboard. It provides an overview of the performance of all skills associated with active agents on the account.
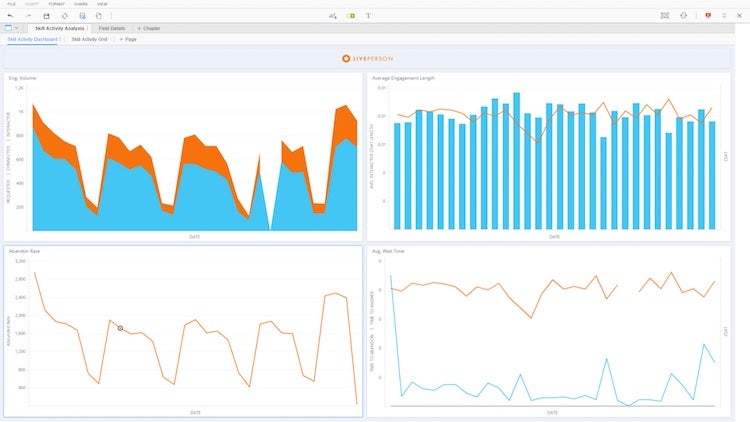
Image 1 - Skill activity dashboard main panel
Panel 2: Skill Activity Grid
| Graph Name (Type) | Vertical / Angle (Metrics) | Horizontal / Color (Attributes) | Additional functions |
| Eng. Volume(area chart) | REQUESTED CHATS | DATE | N/A |
Panel two: skills activity grid
The following grid view presents information available on a daily basis which can be exported to excel for further manipulation of the data, primarily by skills, agent groups, and day of the week.
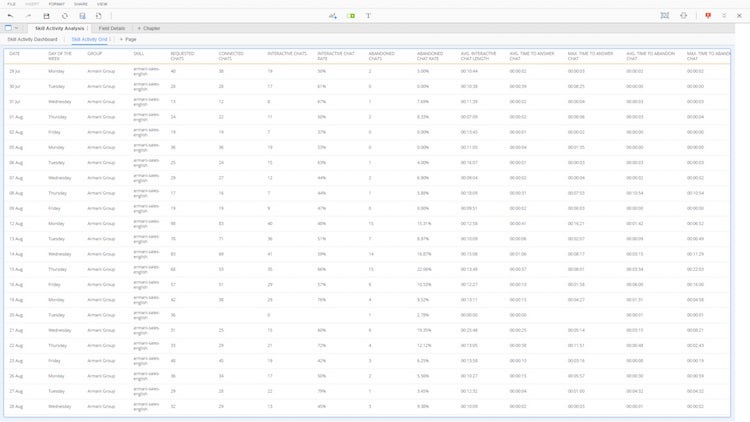
Image 2 - Skills activity grid (panel 2)
Rows (attributes): Date, day of week, group, skill
Columns (metrics):
- REQUESTED / CONNECTED / INTERACTIVE CHATS
- INTERACTIVE CHAT RATE
- ABANDONED CHATS
- ABANDONED CHAT RATE
- AVG. INTERACTIVE CHAT LENGTH
- AVG. TIME TO ABANDON / ANSWER CHAT
- MAX TIME TO ABANDON / ANSWER CHAT
Note:
This dashboard is also available in BI.
Predefined grid
The grid spreads out all the relevant metrics in a granular view so any member on the account may easily download the grid or receive scheduled copies to their email.
Perform the analysis and customization you need using an offline copy, in excel using the complete grid. You can choose the document type (daily/monthly) based on your needed timeframe. The daily grid gives daily aggregations for all the metrics while the monthly grid offers the corresponding aggregations at the monthly level. The data is presented at the brand, campaign and engagement level.
Metrics
For all metrics available within this dashboard please search the Analytics Builder Data Metrics by the name of the dashboard in the Developer Center.
Missing Something?
Check out our Developer Center for more in-depth documentation. Please share your documentation feedback with us using the feedback button. We'd be happy to hear from you.