Agent activity dashboard
This dashboard includes operational metrics used to analyze agent activity and performance. This dashboard also entails hour offset capabilities allowing users to show the data with an offset to match the time zone where they manage their operation.
- Primary datasets: agent activity, conversions, engagements, surveys, Collaboration Channels, PCI forms
- Primary filters: agent, agent group, skill
- Minimum timeframe: hourly
The dashboard contains metrics which are relevant for chat and messaging agents such as online time and Away reason, and also metrics which are available only for chat or only for messaging.
To find out which metrics are available for which channel, please refer to reporting metrics.
Available Channels:
| DataSets | Chat | Messaging |
| Agent Attributes | Yes | Yes |
| Agent Productivity | Yes | Partially |
| Agent Status | Yes | Partially* (see note below) |
| Agent Utilization | Yes | No |
| Conversions | Yes | No |
| Queue Health | Yes | No |
| Collaboration | Yes | Yes |
| Secure Form (PCI) | Yes | Yes |
| Surveys | Yes | No |
Main panel: agent activity dashboard
The following default panel will be presented when accessing the agent activity predefined dashboard. It provides an overview of the performance of all agents active on the account.

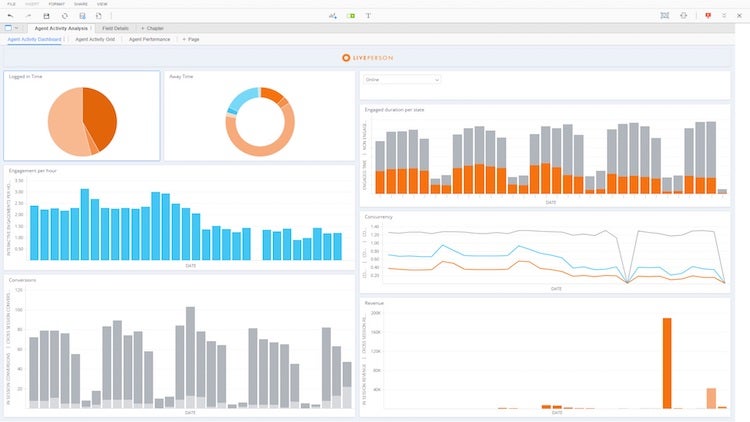
Image 1 - Agent activity dashboard main panel
Visualizations:
| Graph Name (Type) | Vertical / Angle (Metrics) | Horizontal / Color (Attributes) | Additional functions |
| Logged in time(pie chart) | LOGGED IN TIME | AGENT STATUS | Hover to view the % contribution of the angle |
| Away Time(pie chart) | AWAY | AWAY REASON | Hover to view the duration of a specific away reason and the % contribution of the angle |
| Engaged duration per state (bar chart) | ENGAGED TIME | DATE | Filter by Agent Status (attribute) |
| NON ENGAGED TIME | |||
| Engagements per hour(bar chart) | INTERACTIVE ENGAGEMENTS PER HOUR | DATE | N/A |
| Concurrency(line chart) | CONC. ENGAGED | DATE | N/A |
| CONC. LABOR | |||
| CONC. LOGGED IN | |||
| Conversions(bar chart) | IN SESSION CONVERSIONS | DATE | N/A |
| CROSS SESSION CONVERSIONS | |||
| Revenue(bar chart) | IN SESSION REVENUE | DATE | N/A |
| CROSS SESSION REVENUE |
Panel two: agent activity grid
The following grid view presents information available on a daily basis which can be exported to excel for further manipulation of the data, primarily by agent groups and day of the week.
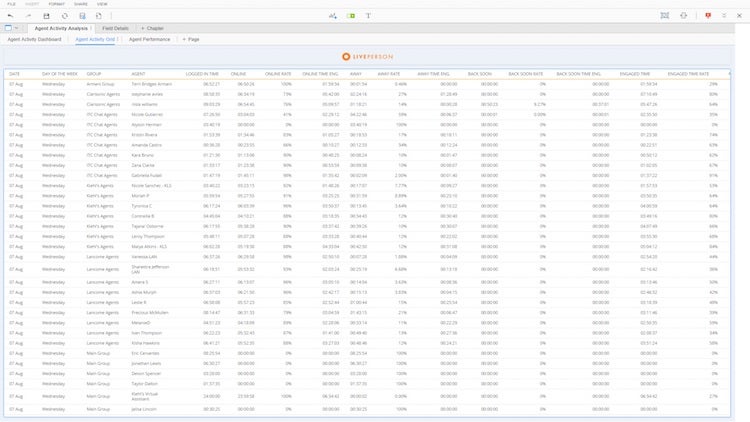
Image 2 - agent activity grid (panel 2)
Rows (attributes): DATE, DAY OF THE WEEK, GROUP, AGENT
Columns (metrics):
- LOGGED IN TIME
- ONLINE / AWAY / BACK SOON (time)
- ONLINE / AWAY / BACK SOON RATE
- ONLINE / AWAY / BACK SOON TIME ENGAGED
- ENGAGED / NON ENGAGED TIME
- ENGAGED / NON ENGAGED RATE
- CUMULATIVE ENGAGED CHAT TIME
- LABOR TIME / RATE
- INTERACTIVE ENGAGEMENTS PER HOUR
- CONC. LOGGED-IN / LABOR / ENGAGED
- CONVERSIONS
- IN SESSION / CROSS SESSION CONVERSIONS
- REVENUE
- IN SESSION / CROSS SESSION REVENUE
- INTERACTIVE CHATS
- AVG. INTERACTIVE CHAT LENGTH
- CONNECTED CHATS
- NO. OF COBROWSE INTERACTIVE SESSIONS (CHAT)
- NO. OF SECURE FORM (PCI) SUBMITTED (CHAT)
Panel three: agent performance
The following grid view presents agent performance metrics for the entire duration of the time selected in the date filter available on the dashboard. The grid data may be exported to excel to manipulate the data further, such as by grouping the agents into custom groups based on their performance.

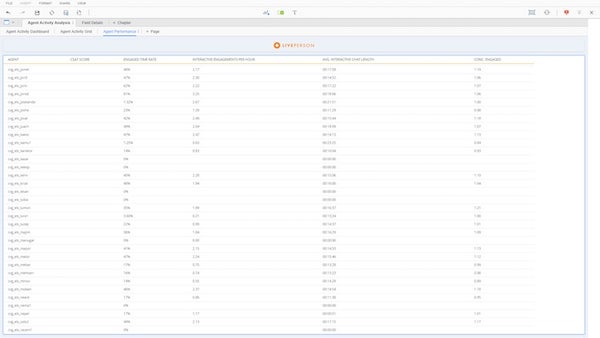
Image 3 - Agent performance (panel 3)
Rows (attributes): AGENT
Columns (metrics):
- CSAT SCORE
- ENGAGED TIME RATE
- INTERACTIVE ENGAGEMENT PER HOUR
- AVG. INTERACTIVE CHAT LENGTH
- CONC. ENGAGED
Note:
This dashboard is also available in BI.
Predefined grid
The grid spreads out all the relevant metrics in a granular view so any member on the account may easily download the grid or receive scheduled copies to their email.
Perform the analysis and customization you need using an offline copy, in excel using the complete grid. You can choose the document type (daily/monthly) based on your needed timeframe. The daily grid gives daily aggregations for all the metrics while the monthly grid offers the corresponding aggregations at the monthly level. The data is presented at the brand, campaign and engagement level.
Metrics
For all metrics available within this dashboard please search the Analytics Builder Data Metrics table by the name of the dashboard here.
Missing Something?
Check out our Developer Center for more in-depth documentation. Please share your documentation feedback with us using the feedback button. We'd be happy to hear from you.