Report Center User Guide
Getting started with the Report Center
Creating a new dashboard
- On the Navigation bar, select Bot/Report Center to view available dashboards.

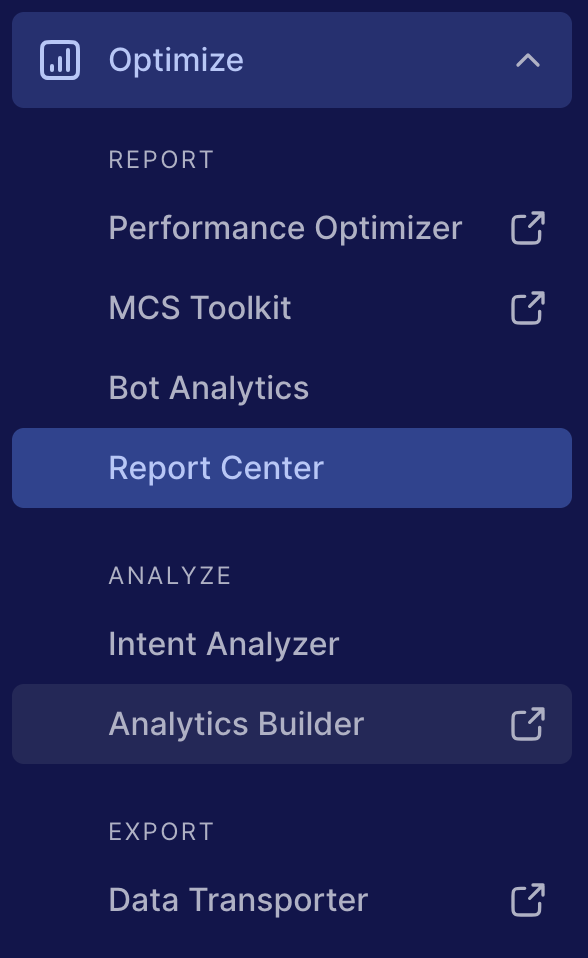
RC: Navigation Bar
2. Click on the Plus


RC2
icon next to the dashboard header.
3. Select a pre-populated template for use or start from a blank report.

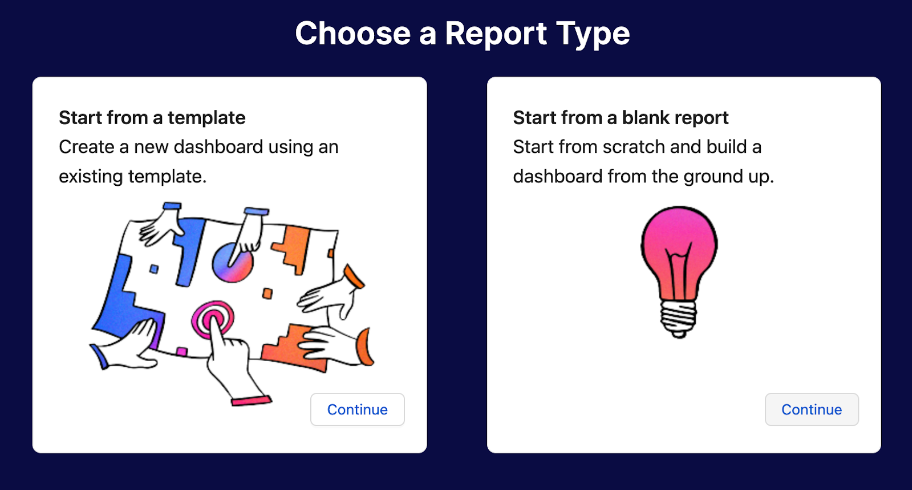
RC3
4. Add a name for your dashboards and save.
Edit a dashboard and use filters
1. To filter data in any dashboard; Select the dashboard and click on the Filter button.


RC4
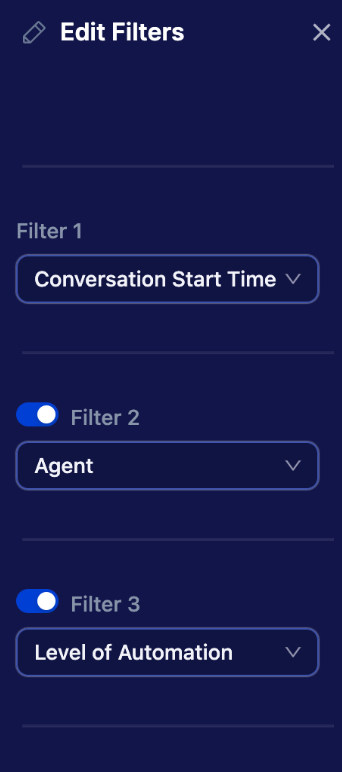
2. A drop down menu will appear on the right side of your screen. Select your needed filters. You can use the toggle functionality (Filter 1 & Filter 2) to choose two filters as per your needs.

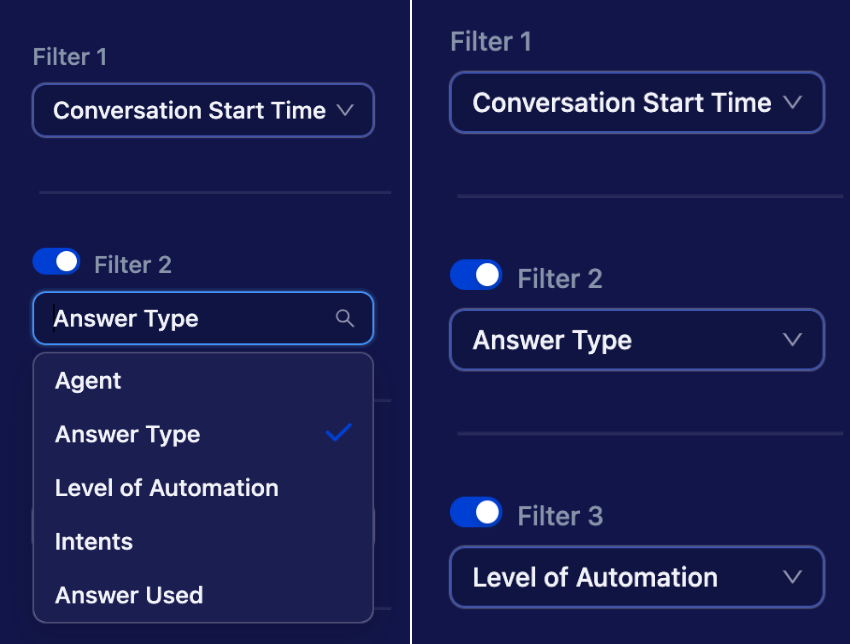
RC5
3. To Edit the dashboard, click the Pencil


RC6
icon on the top right corner of the dashboard.
4. Once in a dashboard Edit Mode, use the Edit button on a chart to select metrics.

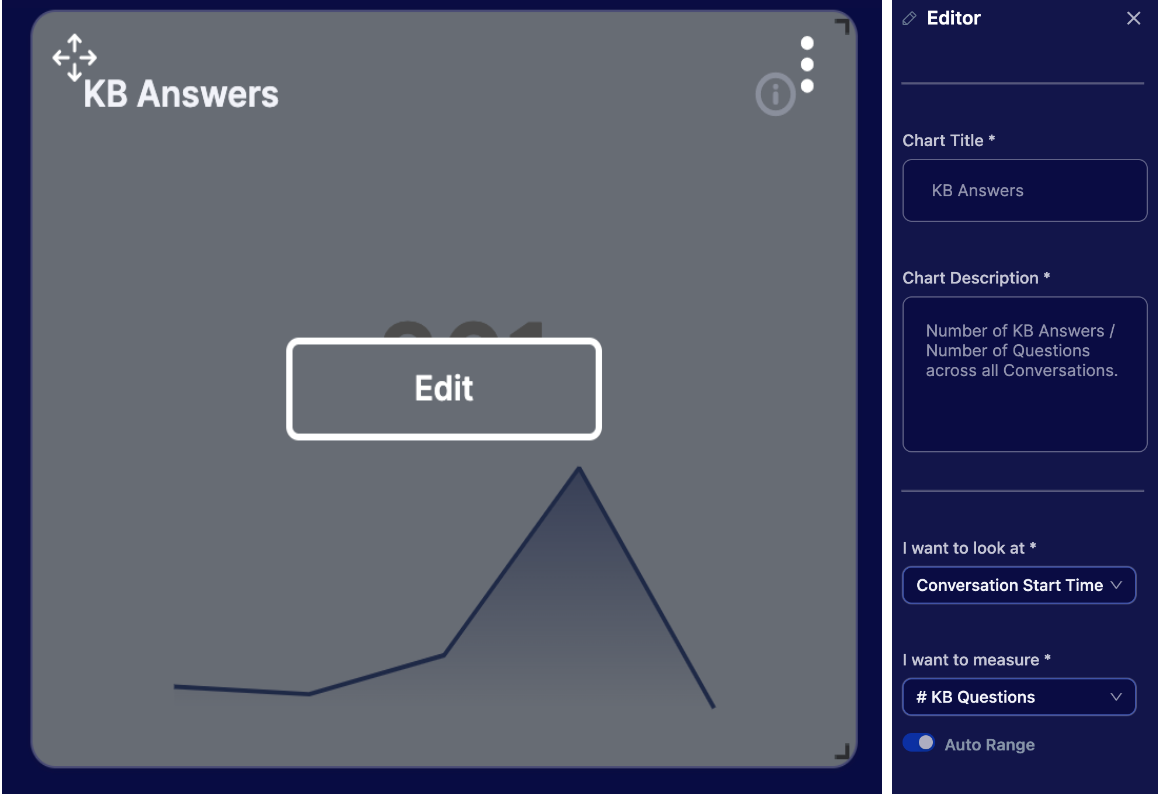
RC7
5. On an Edit Mode, click the Create New Chart drop down menu on the left hand corner of the dashboard. Use required charts from the drop down menu as per your need.

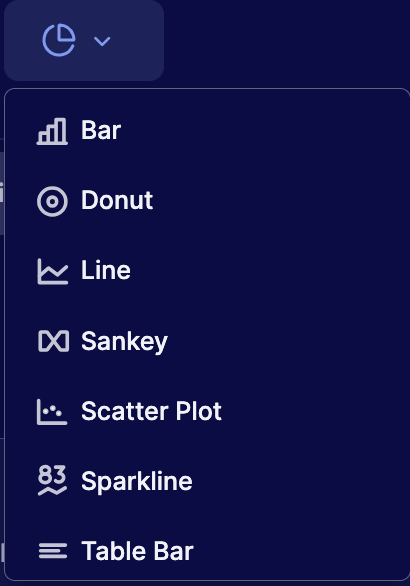
6. You can also use the filter/time option provided on top of a dashboard to select the provided filter and timeframe.

RC8
Transcript Viewer
1. Click on the Conversation


button on the top right corner of the dashboard.
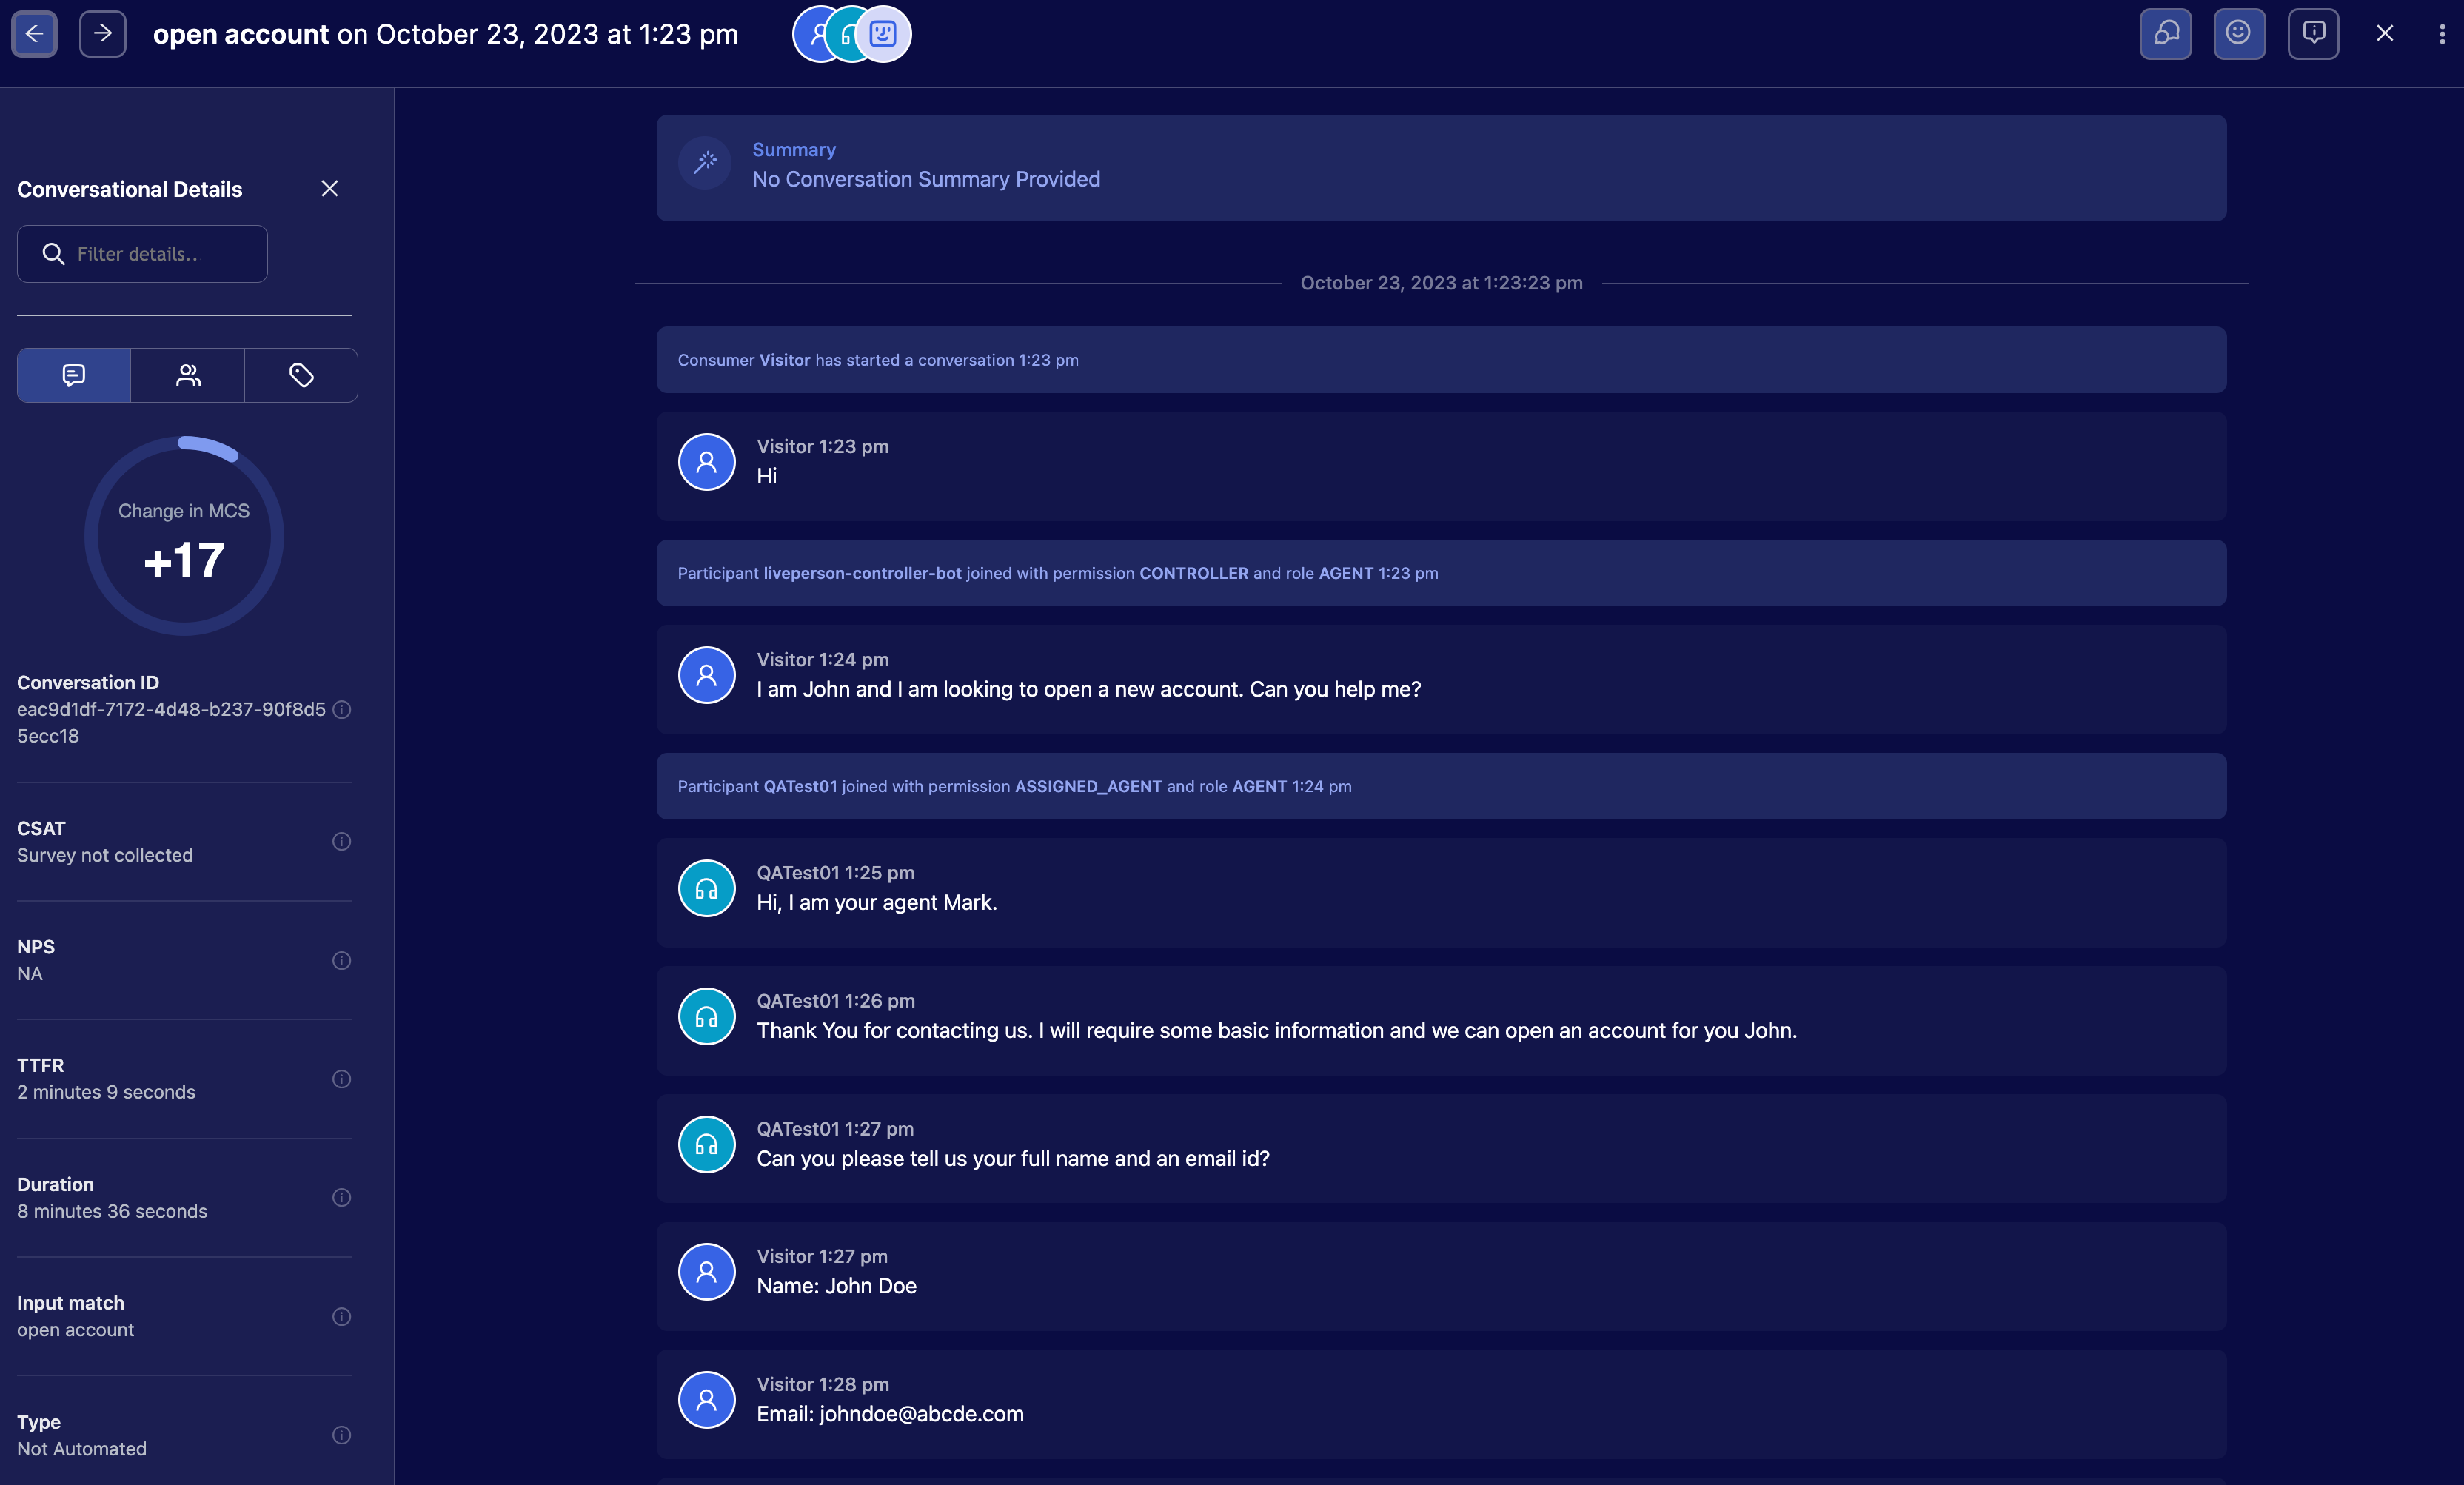
2. A conversation list opens up in the dashboard. Conversation list is per conversationId and the associated metrics.
3. Click on a conversation list, this opens up the transcript associated to a conversationId. Find below the Transcript Viewer.

Keyword Search
- A feature to search transcripts with keyword is available for use. Please look at the demonstration provided below.


Data Transporter integration with Report Center
- A demonstration for access is available below. Access to the integration is provided to admins and agent managers who have three permissions enabled.
a. Data Transporter: access enabled
b. Data Transporter: view and download history
c. Data Transporter: manage tasks - A demonstration on the use of the data transporter is included below.
Understanding Metrics
When using the report center you can include a variety of metrics to provide valuable insights for your generative AI use case. A key point to keep in mind while using the metrics would be that they are a conversation/message level and filter capabilities work in the same manner.
Here are the metrics that can be considered while creating your dashboard and charts.
Copilot Assist and Copilot Rewrite Metrics
| Metrics | Definition |
| Total Conversations | Number of unique conversations in the account |
| # KB Questions | Number of knowledge base (KB) queries/questions that Conversation Assist (CA) requested KnowledgeAI (KAI). (These queries may or may not have answers provided by KAI) |
| KB Total Answers | Text provided by KAI to the CA based on KB Articles or Large Language Model (LLM). (KB Generative Answers + KB Standard Answers) |
| KB Standard Answers | Number of standard text provided by KAI using KB article/links. |
| KB Generative Answers | Number of generative (LLM) text provided by KAI. Ex: Total Conversation: 100, # KB Questions/Queries: 50, KB Total Answers (May Contain both LLM and Standard Answers) = 10, KB Generative Answers = 5, KB Standard Answers = 5 |
| CSAT | Customer Satisfaction Score in percentage |
| No Answers | Number of questions which had no answers surfaced by KAI |
| % KB Answers Rate | Number of KB answers / Number of queries across all conversations |
| MCS | Meaningful Conversation Score |
| In Focus Time | Time spent by human agents focused on conversations they are assigned to. Unit: Minutes Time: Enter conversation - Leave Conversation |
| Agent Recommendation Shown | Number of answers provided by CA to agents. These answers may or may not be used by agents. Each query may have one or more recommendations provided. |
| Agent Recommendation Used | Number of answers used by agents. Agents in CA can choose to use the answers provided by KAI. If the Use Answer Button is clicked, it will be marked as an Agent Recommendation Used. |
| Agent Recommendation Used Rate | Number of Agent Recommendations Used / Number of Agent Recommendations provided |
| Rewrites Used (Dimension) | Provides information if rewrite is used in a conversation. Marked true if rewrite was used else false |
| Total Rewrites Used | Total times a rewrite message was used by an agent in a conversation |
| Total Rewrites Modified and Used | Total times a rewrite message was modified by the agent and used in a conversation |
| Total Wand Clicks | Total times the wand was clicked to change agent message before use |
| Total Conversations with Wand Clicks | Total unique conversations with wand clicks |
FAQ
Which roles have access to Report Center?
Report Center has two models called conversation and engagement controller.
Conversation: Agent Managers have access to their agent data. Main Group managers will have access to the complete account data.
Engagement Controller: Campaign Managers and Admins have access to EC data.
Missing Something?
Check out our Developer Center for more in-depth documentation. Please share your documentation feedback with us using the feedback button. We'd be happy to hear from you.