Campaign dashboard and data bar
The campaign data bar and dashboards described below will provide you with high-level information to assist you in measuring your campaigns. For more detailed reports and dashboards, please visit the data and reporting section.
The campaign-level data bar
Campaign data is displayed and updated every hour, enabling you to make quick decisions about your campaigns and engagements at any given time. The data bar displays the visitor funnel: total visitors, those exposed to data, those engaged, incremental conversions, and incremental revenue.


Prospects
Represents the number of monitored visits eligible (targeted by this specific campaign) to receive at least one graphical engagement (invitation, button, or content) from this specific campaign.
Exposures
Represents the number of graphical engagements that are displayed to the visitors from this specific campaign; for example, buttons, invitations, and content.
Engagements
Represents the number of clicks on content and interactive chats
Conversions
Represents the number of conversions generated by visitors exposed to this specific campaign (regardless if they engaged or not)
Goals are categorized either as Business goals or Assisting goals.
- Business goals include “sell a product or service” and “generate leads”. These goals will be considered Conversions when they are reached.
- Assisting goals include “increase page views” and “other goals” and are considered Goal Reached when they are reached.

The campaign-level dashboard

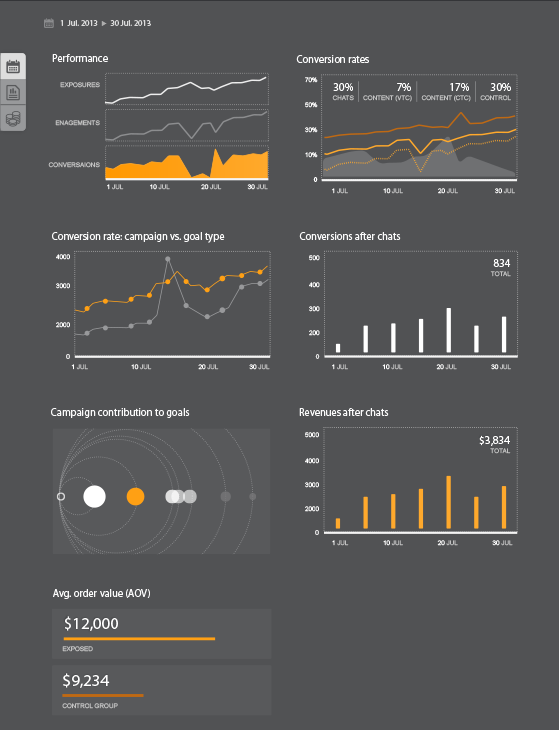
Performance
This widget displays the comparison between exposures, engagements, and goals reached over time. Expect to see goals reached/conversions (depends on the goal type of the campaign) trending with a similar slope to those of the exposures and engagements.
Goal reached /conversion rates (depending on the goal type of the campaign)
Conversion rates of the different channels:
- Chat goal reached/conversion rate - goal reached /conversion rate after interactive chat
- Content goal reached/conversion rate - goal reached/conversion rate after content exposures
- Control group - goal reached/conversion rate of the control group
This widget compares the trend of goal reached/conversion rates of chats, view-through goal reached/conversion rates for content, and click-through goal reached/conversion rates for content, over time. Here you can see which channel is giving you the best goal reached/conversion rates. Since the costs of channels differ, you want to make sure that you are using the most cost-effective channel in your campaigns. Here you can also see the effectiveness of the channels that are used by comparing the chat and content goal reached /conversion rates to those of the control group.
Conversion/goal reached rate: campaign vs. goal type
This widget compares the trend of the conversion/goal reached rate for the selected campaign vs. the average conversion/goal reached at the rate of all the campaigns of the same goal type. Expect to see the trend of your campaign (the orange line) above the grey average line. If the trend of your campaign is below the average, you should probably adjust the campaign.
Conversions/goal reached after chats or content click
This widget displays the total number of conversions/goals reached that was achieved following interactive chats or content clicks, over time (depending on what channels the campaign offers).
Campaign contribution to goals
This widget provides additional information; it displays the number of times that different goals were reached as a result of the visitors’ exposure to graphical engagements that belonged to this particular campaign, as a side effect. The small, white ring at the left represents the current campaign.
The orange circle is the goal of the current campaign. The other circles represent other goals and the relative effect that this campaign had on them. Circle that is lighter in color, smaller, and further away were less affected by the current campaign than those that are darker, closer, and larger to the campaign at the left.
Revenues after chats or content click
This widget displays the total number of revenues that were generated following interactive chats or content clicks, over time. Revenue is displayed only for campaigns with Sales goals.
Average Order Value (AOV)
Here, compare the AOV of visitors who were exposed to this campaign to those who were in the control group and not exposed to this campaign. If the AOV of exposed visitors is higher than that of the control group visitors, then your campaign has had a positive effect on AOV. This widget will be displayed if revenues are generated following exposure to this campaign and only if a control group is defined for this campaign.
Example
To measure the effectiveness of the campaign, and calculate the lift in revenue that results from a particular campaign, we need to know how much additional revenue was generated as a direct result of the campaign. Let’s look at an example of how control groups can provide this information.
It’s the end of winter and you’re having a sale on coats. You’re offering a 20% discount on all the coats. To check if your campaign is effective, you have defined a control group that includes 10% of your visitors. These visitors will not see the campaign for which you have defined your target group as “all visitors to your site.”
After one week, you find the following results. There were 1,000 visitors to your site. Since you defined 10% as your control group, only 900 viewed the offer. The other 100 visitors did not.
Even without seeing the offer, 10% of the customers in the control group bought coats anyway. On average, they each spent $100. The expenditure of these customers represents the potential revenue generated by the entire target audience, had there not been a campaign at all. In the absence of any campaign, therefore, we can extrapolate that the total revenue would have been:
1,000 customers x 10% conversion rate x $100 (AOV) = $10,000
Now let’s calculate what your actual revenue was;
From the first group (viewed the offer) => 270 customers x $150 (AOV) = $40,500
From the Control Group => 10 customers x $100 (AOV) = $1,000
Total = 40,500+ $1,000 = $41,500
The difference between the actual revenue and the revenue without a campaign is calculated as follows.
$41,500 - $10,000 = $31,000
In other words, the campaign generated an additional $31,000 in revenue for you.
| Viewed the offer | Control Group | Total | |
| Size of Group | 900 customers | 100 customers | |
| Visitors that Purchased | 270 customers | 10 customers | |
| Conversion Rate | 30% | 10% | |
| Average Order Value | $150 | $100 | |
| Total Actual Revenue | $40,500 | $1,000 | $41,500 |
| Total Revenue (without campaign at 10% conversion) | $9,000 | $1,000 | $10,000 |
| Difference | $31,000 |
Missing Something?
Check out our Developer Center for more in-depth documentation. Please share your documentation feedback with us using the feedback button. We'd be happy to hear from you.