HAR files web requests and web traffic
When troubleshooting complex issues, our support engineers sometimes needs to get some additional information from you to investigate further. For example, when we receive a report of performance trouble when using the Conversational Cloud, many different factors may contribute to the problem. We need more data to narrow down the cause of the performance problem.
Google Chrome, in particular, makes it relatively easy to capture all the data we need using what's called a HAR file. For this reason, we may ask you to generate a HAR file to help troubleshoot the trouble you're experiencing. Please see the following directions for how to generate a HAR file.
Below are instructions for generating a HAR file from different browsers.
Generating a HAR File from Google Chrome
Chrome can generate HAR files using the Chrome Developer Tools. To learn more about Chrome's developer tools, see Chrome DevTools Overview.
- Open Chrome and enable the Developer Tools from Tools-->Developer Tools.
- Select the Network tab.
- Check “Preserve log” and “Disable cache”
- Load the page with the issue.
- Please refresh the browser's active tab and capture a full page load so we can see the requests made before the problem we're analyzing. Note: This is required in order to capture websocket traffic.
- Complete the steps that trigger or demonstrate your issue.
- Click on the "Export HAR" button
- Check the HAR file:
- Open another Chrome instance
- Enable its Developer Tools
- Select the Network tab
- Drag and drop the HAR file to check that Chrome has saved it correctly
- Zip and send the file to the Support case.
Opening Chrome Developer Tools for "Shared Workers"
When asked for a HAR file related to a "Shared Worker" in Google Chrome, follow these steps:
- Load the page with the issue.
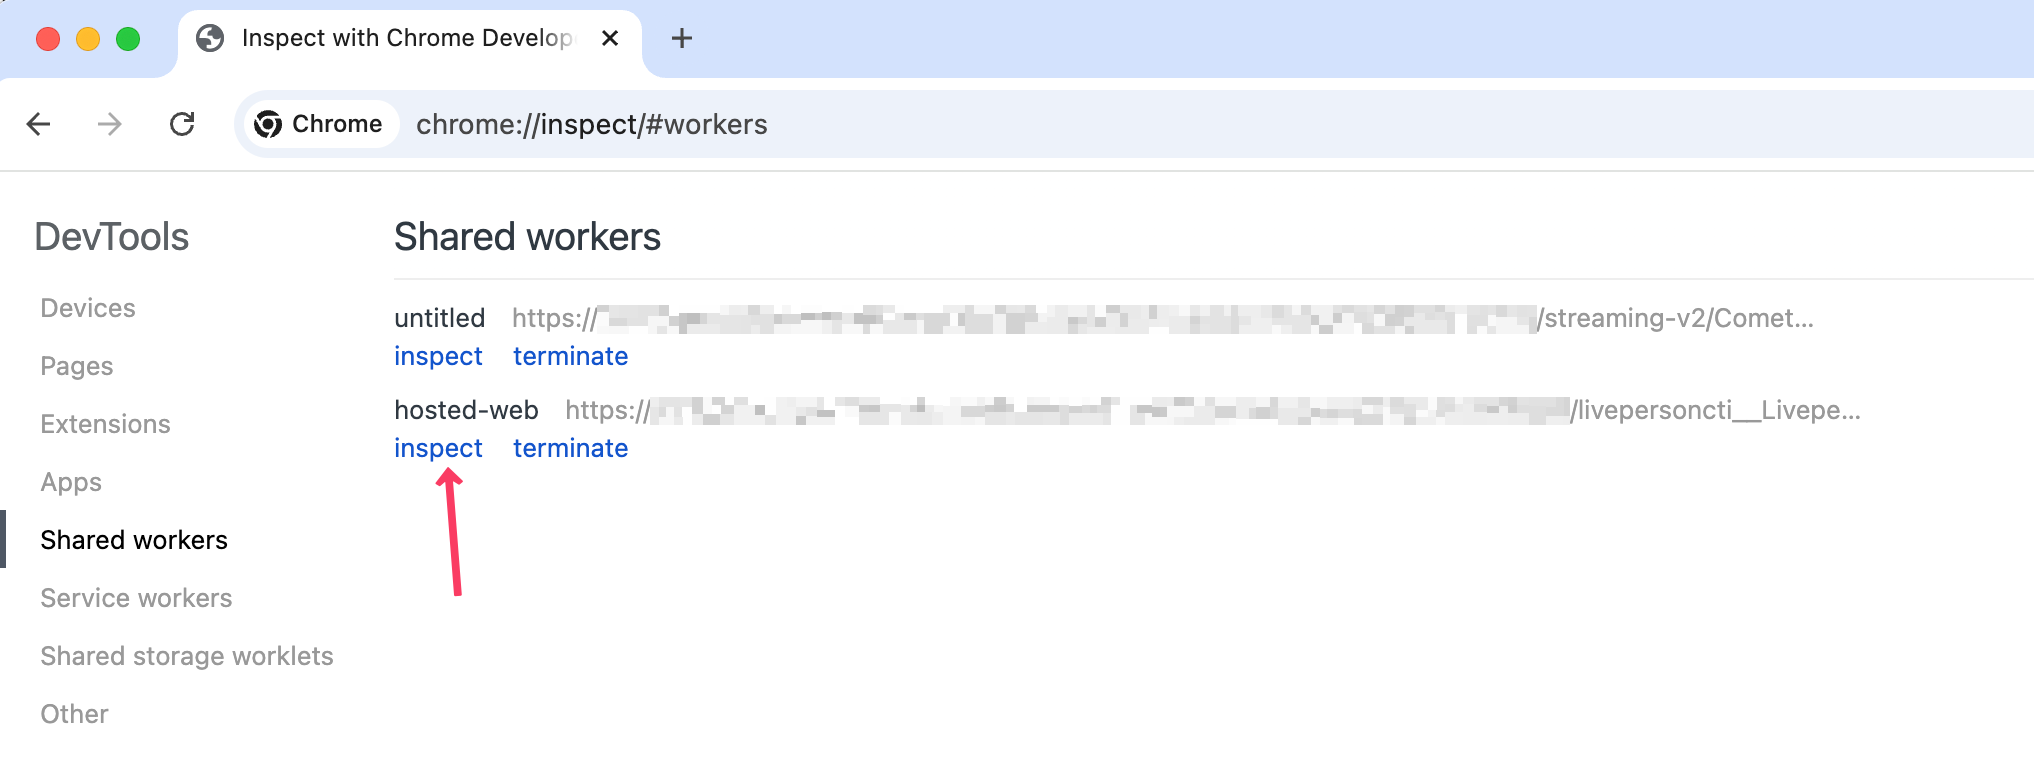
- Visit chrome://inspect/#workers (copy and paste this into a new tab of Google Chrome).
- Click inspect on the applicable shared worker (see screenshot for an example of Salesforce Connector)

Inspect Shared Worker for Salesforce Connector in Google Chrome
Generating a HAR File from Firefox
Firefox can generate HAR files using the Firefox Developer Tools. To learn more about Firefox's developer tools, see Firefox DevTools Overview.
- Open Firefox and enable the Developer Tools from Menu-->Web Developer-->Toggle Tools.
- Select the Network tab.
- Check “Persist Logs” and “Disable cache”
- Load the page with the issue.
- Please refresh the browser's active tab and capture a full page load so we can see the requests made before the problem we're analyzing. Note: This is required to capture websocket traffic.
- Complete the steps that trigger or demonstrate your issue.
- Right-click the Development Tool on one of the requests on the left and select “Save all as HAR with content”.
- Check the HAR file:
- Open another Firefox instance
- Enable its Developer Tools
- Select the Network tab
- Drag and drop the HAR file to check that Firefox has saved it correctly
- Zip and send the file to the Support case.
Generating a HAR File for Microsoft Edge
Edge can generate HAR files using the Chrome Developer Tools. To learn more about Edge's developer tools, see Edge DevTools Overview.
- Open Edge and enable the Developer Tools from Tools-->Developer Tools.
- Select the Network tab.
- Check “Preserve log” and “Disable cache”
- Load the page with the issue.
- Please refresh the browser's active tab and capture a full page load so we can see the requests made before the problem we're analyzing. Note: This is required to capture websocket traffic.
- Complete the steps that trigger or demonstrate your issue.
- Right-click the Development Tool on one of the requests on the left and select “Save all as HAR with content”.
- Check the HAR file:
- Open another Edge instance
- Enable its Developer Tools
- Select the Network tab
- Drag and drop the HAR file to check that Edge has saved it correctly
- Zip and send the file to the Support case.
Opening Edge Developer Tools for "Shared Workers"
When asked for a HAR file related to a "Shared Worker" in Microsoft Edge, follow these steps:
- Load the page with the issue.
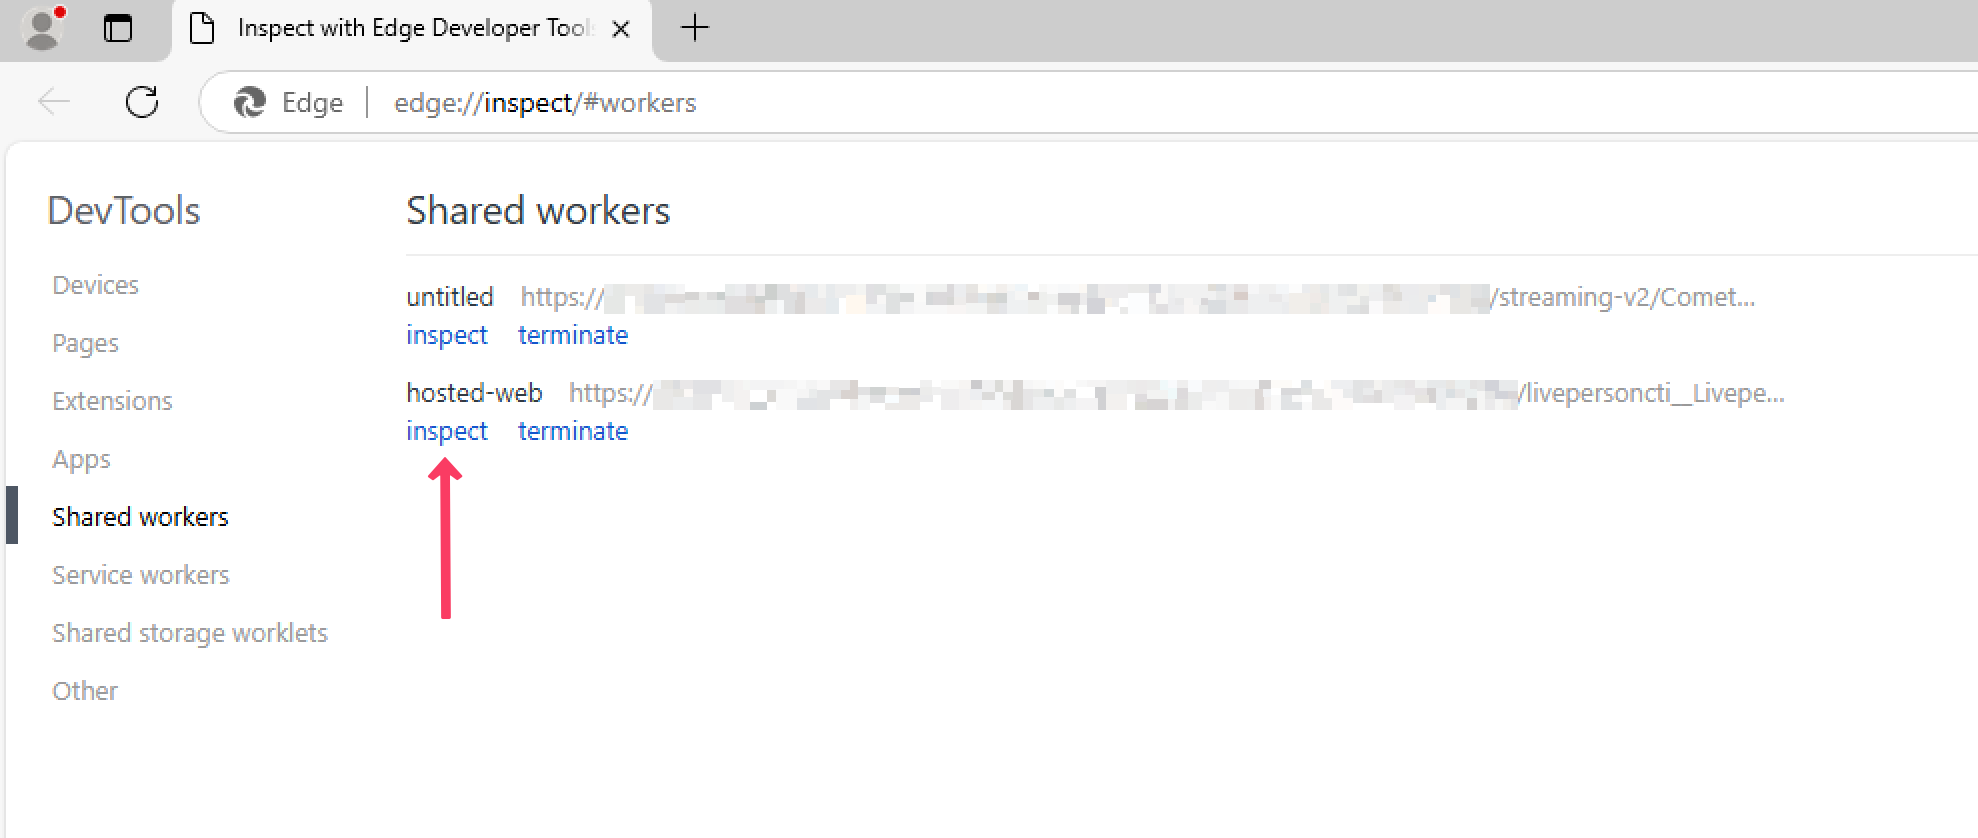
- Visit edge://inspect/#workers (copy and paste this into a new tab of Microsoft Edge).
- Click inspect on the applicable shared worker (see screenshot for an example of Salesforce Connector)

Inspect Shared Worker for Salesforce Connector in Microsoft Edge
Network Issues
Microsoft's Using Windows Internet Explorer Developer Tools Network Capture KB can be used to identify how to diagnose network issues.
Providing Information to Support
- Open IE and enable the Developer Tools by pressing F12 or from the Cog menu icon
- Select the Network tab.
- To persist the logs through page refreshes make sure this button is set to OFF
- Press the green triangle to start recording network traffic
- Load the page with the issue.
- Please capture a full page load so we can see the requests made prior to the problem we're analyzing.
- Complete the steps that trigger or demonstrate your issue.
- Click on the floppy disk icon to save
- Zip and send the file to the Support case.
Generating a HAR File from Safari
Safari comes with its own Safari Web Development Tools.
Recording web traffic with Fiddler
Note:
Fiddler is not part of LivePerson's product set. Although we recommend using it, LivePerson does not provide support for Fiddler.
Instructions:
The two main steps required to record web traffic with Fiddler are:
- Setting Up Fiddler
- Recording a Session
How to set up fiddler
Before recording a session, make sure the HTTPS option is checked as follows:
- Download Fiddler (free software) from Download Fiddler Web Debugging Tool for Free by Telerik.
- Open Fiddler and click Tools -> Fiddler Options.
- Click the HTTPS tab.
- Select the options Capture HTTPS CONNECTS and Decrypt HTTPS traffic; then click OK to complete the setup.
- On the WARNING: Sharp Edges window that opens, click Yes to trust the Fiddler Root Certificate.
- On the Security Warning window, click Yes to install the Fiddler Root Certificate.
Recording a session
- Click File -> Capture Traffic to begin capturing traffic.
- Once you've finished recording, click File -> Save -> All Sessions.
- If a Privacy Notice displays, click OK to approve. (A notice may display, the first time you save a session.)
- Enter a name for the recording file and click Save. The session is saved to the file you specified.
Missing Something?
Check out our Developer Center for more in-depth documentation. Please share your documentation feedback with us using the feedback button. We'd be happy to hear from you.