Performance Optimizer user guide
How to access Performance Optimizer
Logging in to Performance Optimizer requires feature access by request. Only Admin profiles or pre-configured user profiles may log in. (To log in or to customize profile authorization, contact your account manager).
Once your account is enabled, you can begin by logging in here.
HINT: You can also log in directly via the Quick Launch menu in Conversational Cloud.
Login Page
You can also log in directly via the Quick Launch menu from Conversational Cloud.

- Enter your Account Number and click Sign in. The Conversational Cloud Login Screen is displayed.
- Enter your Username and Password.
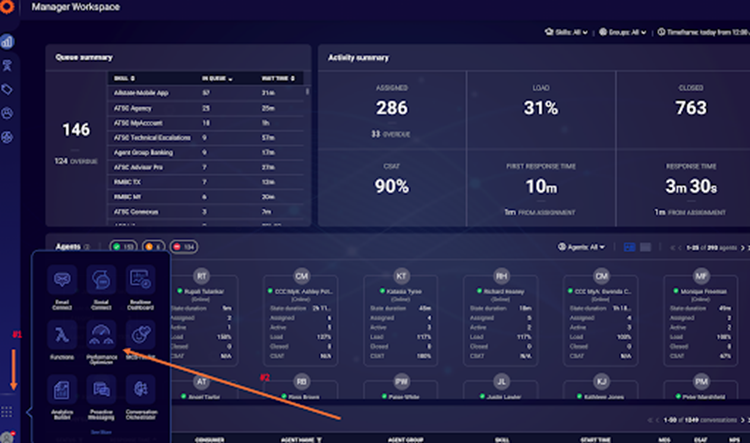
- To access via Quick Launch select the icon located at the bottom of the left toolbar (9 dots).
- Select the Performance Optimizer icon.

Getting Started in Performance Optimizer
Performance Optimizer Dashboard
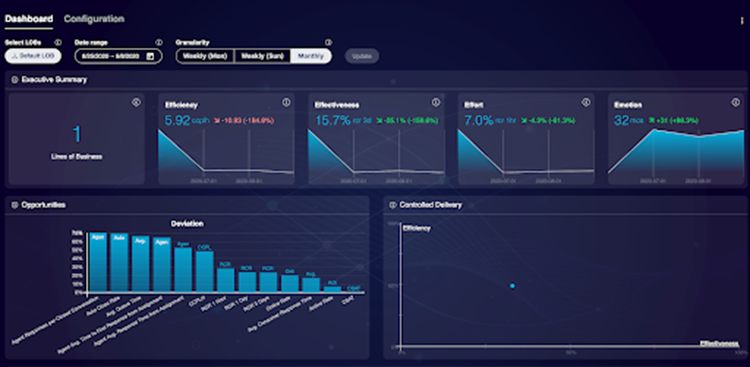
After login, the Dashboard is displayed.

Configuration
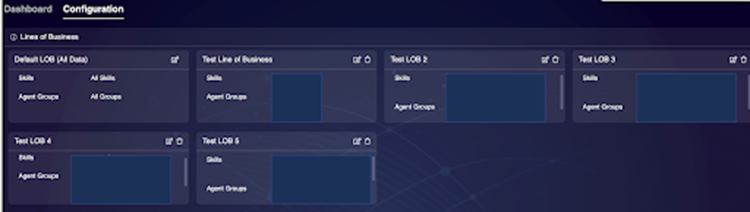
To fully experience the advantages of the Performance Optimizer, LOBs must be configured through a selection of skills and groups in the Configuration tab of the Performance Optimizer. If LOBs are not configured, the Performance Portal will display all skills and groups as a singular LOB. There is no limit to the number of LOBs that can be created.
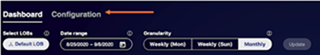
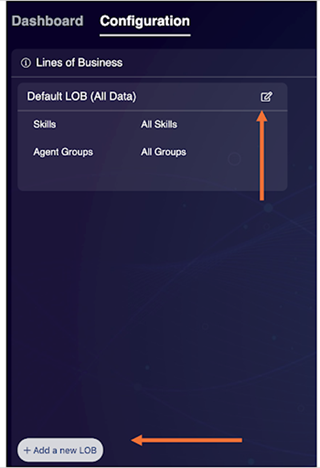
Select the Configuration tab in the upper left corner.

Creating a Line of Business
- To create a new LOB, click the Edit icon within the “Default LOB (All Data)” box or the “Add a new LOB” button at the bottom left of the Configuration screen.

2. Enter the required LOB Name.

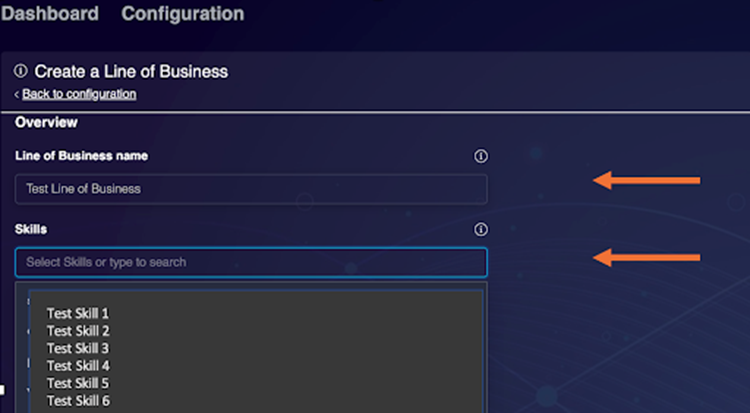
3. Click Skills to display a drop-down menu of ALL current Skills defined for the Account ID. Select all the skills that should be included within the LOB.
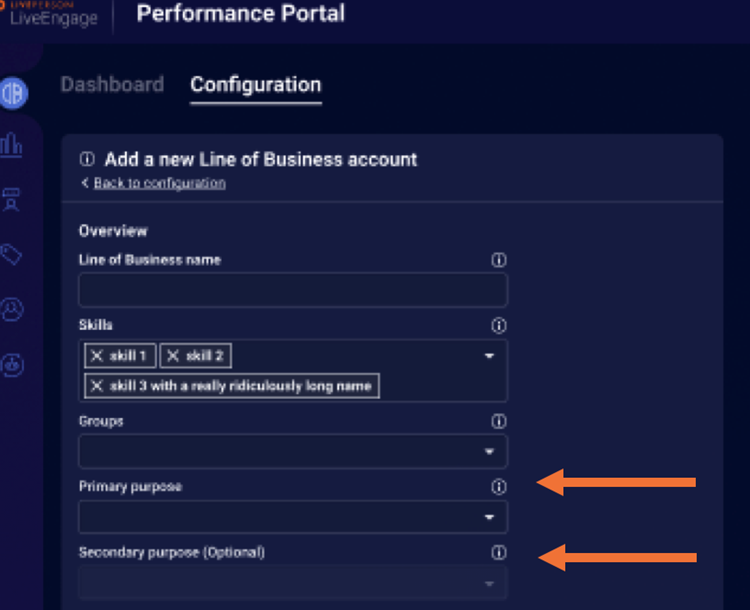
4. Click Groups to display a drop-down menu of ALL current groups for the Account ID. Select all the groups that should be included within the LOB.
5. Click Primary Purpose to display a drop-down menu of all Primary Purposes for a LOB.
Select one of the following Primary Purposes:
- General Multi-Purpose / Universal Agents (DEFAULT)
- Agent Support
- Backoffice/Administration
- Collections
- Care
- Complaints
- Retentions
- Sales
- Tech Support
6. Optionally, you can select a secondary purpose for the LOB by clicking on Secondary Purpose and displaying the same drop-down menu options as before, now defining the Secondary Purpose.

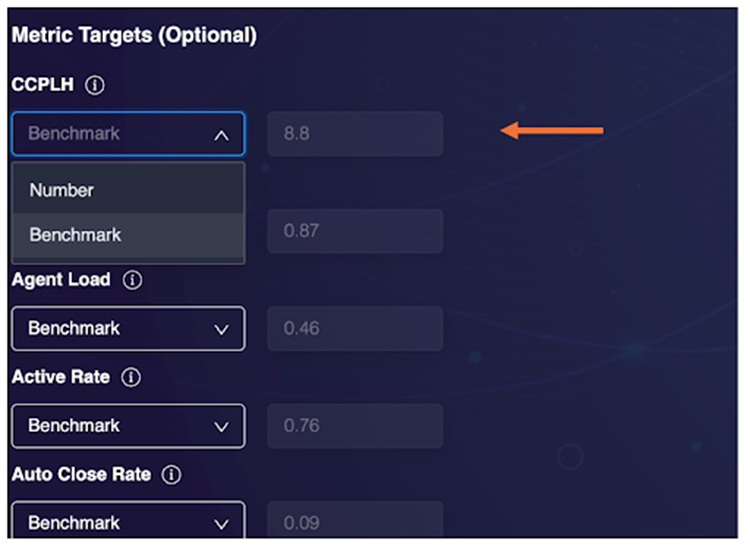
7. The Metric Targets area lists metrics that are key drivers for the 4 categories of the 4E Framework. For each metric:
Select Benchmark to compare the brand’s performance with the global vertical benchmark
Or:
Select Number, and then enter a unique brand-specific target value or SLA. This option will visualize the brand’s performance data about this value.

8. Click “Create LOB” to display a summary of the newly created LOBs.

9. Click back to “Dashboard” to view your Performance Optimizer settings with your newly created LOBs.
Filtering Your Performance Optimizer View
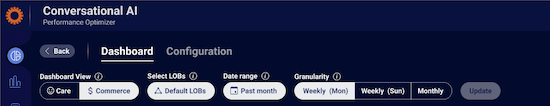
Select Your Dashboard View: Commerce or Care
The Performance Optimizer supports two views: Care and Commerce. The Commerce view exposes additional sales metrics to users including conversion rate, conversions, conversions per login hour, and average order value.
The LivePerson 4E Framework incorporates these sales metrics when users select the Commerce View and identifies sales-specific metrics for efficiency (conversion rate per login hour) and effectiveness (conversion rate). The primary indicator of efficiency and effectiveness dynamically changes when the Commerce view is chosen by the user.
| 4E Framework Primary Indicator | Care | Commerce | Panel with Dynamic Metric |
| Efficiency | Closed Conversations Per Login Hour (CCPLH) | Conversions Per Login Hour | Executive Summary LOB Detail |
| Effectiveness | Repeat Contact Rate - 3 Day (RCR 3 Day) | Conversion Rate | Executive Summary LOB Detail |
To Select Commerce View:
- In the top left part of the screen, select the Commerce tab. By default, the view will be set to Care.
- Select Your Filter Options or use default filter settings (see “Filtering Your Performance Optimizer View” below)
- Click Update

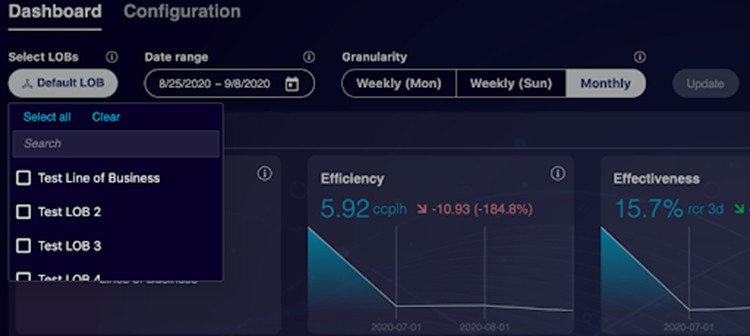
Selecting Filter Options
The Performance Optimizer can be filtered to display only the most relevant data. These criteria include the LOB, Date Range, and Granularity View, e.g., Weekly (Monday), Weekly (Sunday), or Monthly. The default filter selections will include all LOBs for the previous 2 weeks and a monthly view. Up to 13 months of historical data can be accessed. The current date or real-time information is not available within the Performance Optimizer.
To filter the dashboard:
- In the top left part of the screen, select your LOB(s), date range (by calendar selection or manual entry), and granularity preferences.
- Click Update. The data will now be displayed according to your preferences.

Performance Optimizer Panels
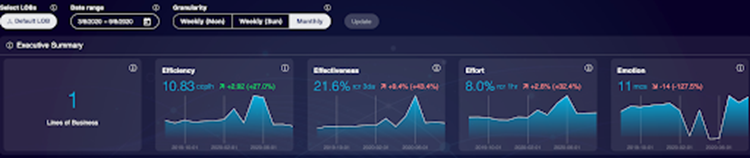
Executive Summary Panel
The Executive Summary Panel, the first panel represented in the Performance Optimizer, is a holistic LOB view of the conversational operation which allows users to:
- Validate the number of LOBs selected through filter functionality.
- View actual performance for the 4E metrics.
- View trends for each 4E metric based on filtered date range and previous timeframe as compared to the entered date range. For example, when selecting 06/01/2020-6/31/2020 (31 days), the numerical trends and trend line reflect the 31 days before 06/01/2020-06/31/2020: 05/01/2020-05/31/2020. View trending values such as:
- The first numerical value (in blue) indicates the brand’s actual performance for the date range entered. For example, the graphic below shows the brand’s CCPLH (closed conversations per login hour) at 10.83.
- Trend arrows with an upward or downward arrow reflect the date range entered. For example, the arrow reflects the date range of 06/01/2020.
- The second value in parentheses displays the deviation of the 1st date range (06/01/2020-06/31/2020) from the previous period (05/01/2020-05/31/2020).
- The trend line displays the performance based on the entered filter date range and the previous period.

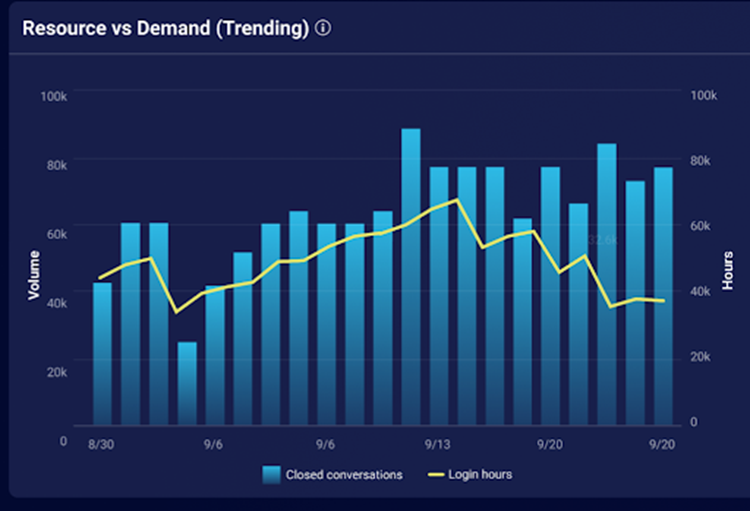
Resource vs. Demand Panel
The Resource vs. Demand panel allows the user to view closed conversations (agent, consumer, and auto-close) and agent login hours over the date range selected by the user in the filter criteria. By correlating closed conversations with login hours brands can optimize their staffing.

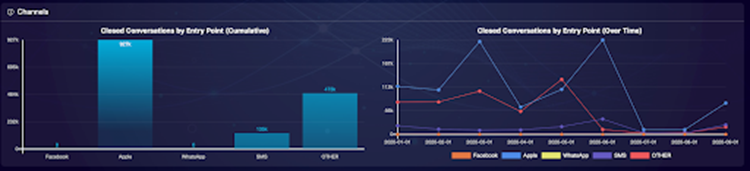
Channels
The Channels panel provides insights into closed conversation volume (agent, consumer, and auto-close) by all possible entry points, based upon the date range entered.
This information can be viewed in two ways:
- The bar chart displays the distribution across entry points
- The line chart displays your entry point volume over time by each possible entry point

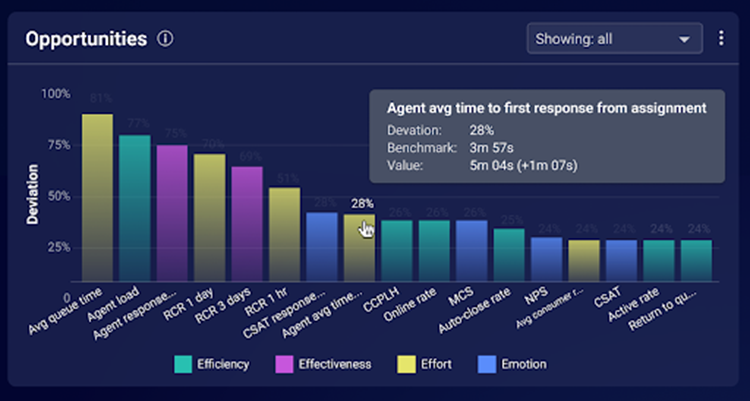
Opportunities Panel
The Opportunities panel is a Pareto-style graph that ranks your primary and secondary 4E metrics based on the deviation from industry benchmarks or target value, determined by metric configuration (benchmark or numerical target). The metrics are color-coded by their respective 4E category then ranked based on which metric has the greatest deviation. This allows the user to focus on the most impactful 4E metric that will improve performance.

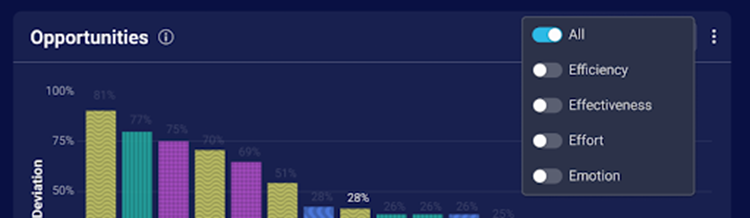
Clicking on the filter drop-down displays a multi-selection option that allows the user to choose the 4E categories to display in the Opportunities graph.

The user can filter by 4E and is also able to click on each bar and automatically navigate to that metric in the 4E detail section at the bottom of the dashboard.
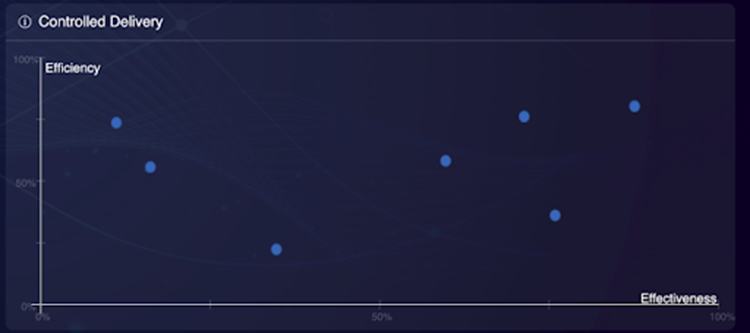
Controlled Delivery Panel
In this panel, each LOB that was selected in the filter criteria is represented by a blue dot on the double-axis chart. The chart compares - for each LOB - the overall 4E scores for efficiency (performing in the best manner with least waste of resources), and effectiveness (the ability to achieve the intended result of resolving the consumer intent). Overall 4E scores are determined by a weighted score of all primary and secondary metrics within the 4E categories for efficiency and effectiveness. Users can quickly assess which LOBs to focus on based on the location of the LOB within the graph. For example, LOBs located in the top right corner of the graph are highly efficient and effective. Conversely, LOBs that are in the bottom left are highly inefficient and ineffective and are recommended to be of priority for the business.
Only LOBs selected within the filter criteria will be displayed. The user may hover over each blue dot to view the name of the LOB and the overall metric score. Clicking on the dot will automatically navigate to the 4E Summary Detail panel.

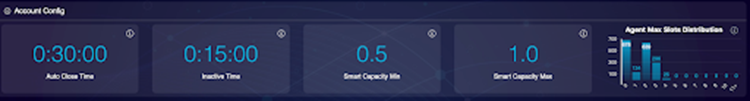
Account Config Panel
The Account Config panel displays specific configuration settings that have the potential to drive a brand’s 4E performance. For example, the setting for Auto Close Time could potentially affect the Effort measured in conversations.
Account Configurations include:
- AutoClose Time
- Inactive Time
- Smart Capacity Min
- Smart Capacity Max

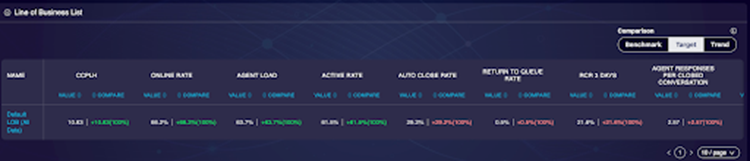
LOB Detail Panel
The LOB Detail panel will display all 4E metrics, primary and secondary, starting with efficiency, effectiveness, effort, and emotion. Only LOB filter selections will be displayed. The user can view data about how each LOB is performing with regards to Benchmark (performance against the industry benchmark), Target (target value if set), and Trend (trending upwards or downwards), by toggling these selections in the upper right-hand corner of the panel. The default view is Benchmark. Actual, Trend, and Deviation values are displayed for each metric based on the filtered date range entered by the user.

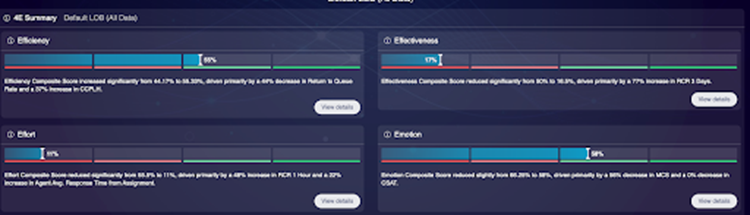
4E Summary Panel
Using the overall 4E score, the 4E Summary panel enables users to view a calculated overall score by each 4E category. Each of the 4E scores incorporates all the primary and secondary 4E metrics for that 4E category and weights those metrics based on the level of impact. The score is then calculated to provide a singular score to represent the 4E category. The graphic below shows the brand’s overall Efficiency score at 55% and its Effectiveness at 17%.
Industry benchmarks are displayed in 25% percentile increments and are color-coded: Red indicates the bottom 25th percentile, and green indicates the 75th percentile. The user can compare their overall 4E scores against the industry benchmark. As an example, the brand’s efficiency score of 55% is within the 50-75th percentile of their industry.

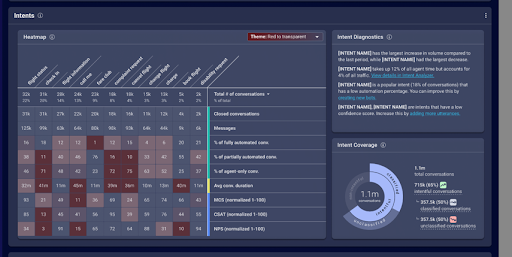
Intent Panel
The new Performance Optimizer Intent Panel creates an intent-focused view answering the question of how effectively an operation resolves its consumers’ intents, the customer experience impact, and provides a clear and simple view(s) that prioritize areas of opportunity and provide clear action items to optimize the intent and operational performance. These views will enable a Performance Optimizer user to understand the intent mix and nature of primary contact drivers into the operation and their evolution over time while identifying intents suitable for automation, increasing efficiency, and reducing operational expenditure. Users have the ability to sort by volume or metrics as well as select the intent domain.
There are 3 primary components to the Intent Panel:
1- A heatmap graphic that will visually prioritize automation opportunities by intent
2- Automated text that contextualizes 4E performance by intent performance
3- Intent classification metrics and graphics
1- The Intent Panel allows users to view the following metrics within the heatmap by Intent for the LOB(s) selected:
- Closed Conversations
- Closed Conversations % of Total
- Avg. Conversation Duration
- Agent Responses Per Closed Conversation
- MCS (normalized 1-100)
- Repeat Intent Rate
- Repeat Contact Rate
2- The Intent graphics shows the metrics below for the LOBs selected:
- Intentful Rate
- Classification Rate
- Total Messages
- Intentful Messages
- Classified Messages
- Unclassified Messages
3- The automated Intent Diagnostics section will include text that will contextualize the performance and provide specific recommendations to improve performance leveraging intent data.

4E Detail Panel
The 4E Detail panel provides a wealth of information for the user to compare each 4E metric, primary and secondary, against industry benchmarks. The user will see their actual 4E performance metric (value in white), how their brand has trended compared to the benchmark (small value in red, in this example), as well as the variance of their performance (value in parentheses, the gap between what was expected and what occurred) against the benchmark. In addition, the user will also see a detailed trend line of the metric performance, as well as a min, max, and mean value for their performance.
Note: Only LOB filter selections will be displayed.
The Diagnostics section provides a detailed narrative of the performance of the LOBs. The Performance Optimizer takes into account all of the 4E metrics (primary and secondary) of the actual performance. It contextualizes the 4E data and the Account Configuration settings (as displayed within the Account Config panel) to provide an automated and customized recommendation for the brand to improve performance based on the LOB and date range selected. By clicking on the “Read More” hyperlinks (in blue) users can view diagnostic playbooks that contain operational recipes for success.

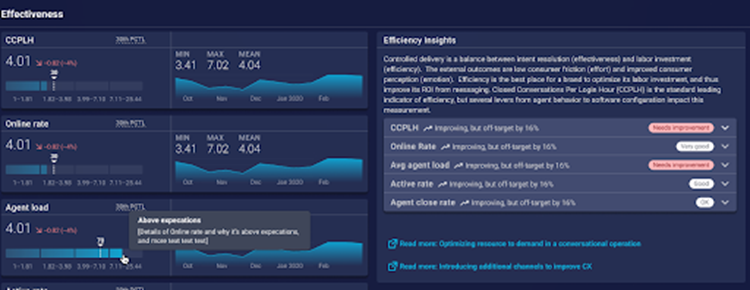
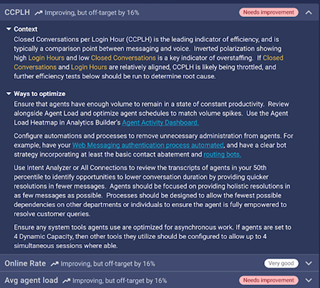
Primary and secondary metrics are displayed for each 4E category. Messages are displayed on the expandible header to indicate if the metric “Needs Improvement” (in red), is “OK” (in white) or “Good” (in white). Clicking the metric header will expand to display Context and Ways to Optimize sections that provide detailed insights and custom tactical steps for improving the metric performance.

Missing Something?
Check out our Developer Center for more in-depth documentation. Please share your documentation feedback with us using the feedback button. We'd be happy to hear from you.