Survey dashboard for messaging
This dashboard provides results of all Post Conversation Surveys that were sent for messaging. The post conversation survey enables brands to collect feedback from consumers and measure their success after a conversation ended. The survey is delivered in a conversational experience to drive higher completion rates and provide consumers with the best experience possible, without any impact on the conversation’s duration.
Brands can customize the survey according to their needs, using predefined questions (CSAT, NPS and FCR), customized questions in free text, and can define the logic among the questions.
Survey results can be analyzed in real time using the messaging interactions API or by historical data in Analytics Builder.
Analytics Builder
Please see the reporting tutorial
The predefined messaging performance dashboard has been enhanced to include a dedicated “survey data export” sheet containing an in-depth analysis of the new messaging post conversation survey flows. The flows included in Analytics Builder are based on the ones configured in the Bot Studio.
The Post Conversation Survey Chapter includes five pages enabling different analyzes both at the results level - consumers feedback, and the survey activity level - understanding how many surveys were closed and what was the outcome (partially completed or timed out, for example).
These grids are ready to export and can be downloaded to include in your contact center or executive dashboards overarching all contact center activities.
To allow the association of survey results with the conversations from which the survey was triggered, all metric results are aligned to the time the conversation ended / the survey flow begun.
Survey data is collected after a survey instance is closed, meaning that activity or results for a survey which is still open to a consumer’s input will not be included in the report.
The“survey data export” sheet contains an additional set of daily aggregated information, metrics and attributes which support the following analysis:
- Predefined KPIs at the agent & skill level: CSAT, NPS, and FCR (pre calculated)
- Detailed brand level answer distribution for each configured question and answer
- Detailed “agent and skill” level answer distribution for each question and answer
- Survey activity and performance, allowing the response rate to be monitored
- Question level performance, allowing the average time to respond to be monitored
In addition to the default grid views, Analytics Builder users with customization privileges can add an hourly view of survey information in the same dashboard. The optional set of metrics which be added to the dashboard by LPA and users with customization privileges include:
- Predefined KPIs at the brand level
- Use “answer value” attribute to derive calculations over predefined questions. For example, create “NPS promoters” or “VSAT” metrics.
- Create an hourly level analysis (the default analysis is at daily granularity)
For more information about customization privileges to the Analytics Builder, please contact your LivePerson account manager or customer success manager.
Aggregation levels
The KPIs on the dashboard can be analyzed on two aggregation levels:
- Brand
- Agent and skill
In a single messaging conversation followed by the submission of a survey by the consumer, multiple agents and skills may be assigned. To eliminate double counting, and to prepare for our phase 2 development (which expands the attribution model not just the last agent assigned), the data model has been prepared accordingly.
Time attribution
The data is collected for closed surveys (consumer can no longer submit responses) and survey results are associated with the time the survey started / conversation ended.
Attribution to agents
Survey results are attributed to the last agent who was assigned to the conversation prior to the initiation of the survey flow. The skill attributed with the survey results corresponds to the one assigned to the conversation along with the same agent (last assigned).
The last agent assigned to the conversation may not have been assigned to the conversation when it was transferred over to the survey bot. For instance, if a manager joined (but not assigned to) the conversation and closed it, consequently triggering the survey flow, the same manager will not be attributed with the survey results.
The results instead will be attributed to the agent who was assigned to the conversation when the manager joined. In the same manner, the last skill which also helped determine which survey to present, will not necessarily align with skill assigned to the conversation along with the last assigned agent.
Primary filters
The survey data can be filtered by - skill, survey name, survey outcome (completed, ignored, skipped, …), is answer recognized by bot (flag, set by default to “Yes”)
Backward compatibility
- “CSAT SCORE” pre-existing in the dashboard has been renamed to include the suffix “unified”. This metric is computed based on both previous version of the survey and the new survey flows. The new survey predefined KPI metrics include activity from the new survey flows, excluding the old survey activity.
- All messaging metrics pre-dating this feature have been completely separated from the survey activity. Therefore, no impact is expected to the metrics used prior to this feature introduction into the dashboard.
- The “resolution” metrics, representing the “old” survey’s resolution (yes/no) question, have been hidden from the predefined dashboard (they are still available for LPAs and customization users to unhide in user-copies).
Pages
The sheet contains five pages in a single sheet
- First three first pages - review survey results
- Last two pages - analyze survey performance (how is the bot performing?)
- The data is presented in grid views for easy export
Main page: predefined survey KPIs
The main page provides a daily summary of survey results with focus on the pre calculated metrics: CSAT, NPS, and FCR. This main view is pre-aggregated by skill and agent, supporting an in depth review of each individual's performance, as reported by consumers.z
To add custom metrics for predefined questions, see creating custom metrics section at the end of this article
Page 2: answers distribution (brand)
The brand level answers distribution includes aggregated count of responses submitted by consumers to each question and for each configured answer option. The results are presented at the brand level, split by configured survey. Leveraging these results, you are able to analyze, for example, how many consumers answered with the value “4” vs. how many answered “5” for a chosen CSAT question.
Skipping a question vs. skipping the entire survey
Should you choose to configure a “skip” answer-option for the question, the answer “skip” along with the number of times consumers chose this option, will appear in the report next to the corresponding question.
After any question the consumer can choose to skip the entire survey or any remaining questions. Counting how many times consumers skipped the survey entirely is reflected through the CLOSED SURVEY metric filtered by the SURVEY OUTCOME attribute (visible in the survey level page ONLY). The response a consumer has given and triggered the skip of the entire survey will not be counted as an answer to a specific question (not visible in the answer distribution pages).
Responses unrecognized by the survey bot as valid answers
Each question includes an additional bucketed answer, supplementing the configured answer-options. This bucket is called “unrecognized by bot”. Each time the bot did not find a match between the consumer’s response to a given question and any of the configured answer-options, the report will count this consumer’s response in the unrecognized by bot bucket. It is important to note that the default filter of “is answer recognized by bot” is set to “yes”, thereby, excluding all unrecognized answers from the report. You may change the filter settings to “no” or to “all” in order to evaluate consumer responses unrecognized by the bot as one of the valid answer options configured in the survey.
Page 3: answers distribution (agent and skill)
Similar to the brand level answers distribution, this page lists every configured question and answer-option, including a count of times consumers responded to each option.
Page 4: survey level analysis
Use this page to analyze the response rates and outcomes of each survey flow configured on your account. Answer questions such as, how long does it take my consumers to complete a survey, or how many consumers let the survey timeout before completing the flow and answering all the intended questions?
The values in the skill filter apply to the skill which triggered the survey (configured in the survey bot as the triggering skill).
Page 5: question level analysis
Use this page to analyze the response rates and time it takes consumers to answer each question individually. Identify opportunities to optimize the question text or change the order of presentation in the survey flow. Correlate the results in this page with the survey level page to identify questions which are presented multiple time to consumers in comparison to the number of surveys closed for each configured survey flow.
Question fallback text is presented in the report for questions which include a backup text phrase. The backup phrase is presented to consumers in end-points which do not support structured content.
Limitations
- SURVEY OUTCOME attribute filters the Survey Level page only.
- Analytics Builder will only reflect data of surveys configured in the Bot Studio. (External bots are not supported at this time).
- Chat survey data is entirely separate from messaging survey data. Chat survey data can be accessed via the existing predefined dashboards (agent activity, survey activity, skill activity, and ops & staffing), while the messaging survey data appears only in the messaging performance predefined dashboard.
- Emojis configured anywhere in the survey properties (name, question name, answer text, etc.) will not be presented in Analytics Builder but replaced with blank spaces.
- Free text questions can not be analyzed.
Custom reports
Pre-aggregated metrics (agent and skill): to view results at agent or skill levels, both the ‘agent’ and ‘skill’ attributes must be added to the grid.
New attributes / filters
Survey attributes:
- Survey active indicator - Is the Survey flow configured with a skill (in use)
- Survey deleted indicator - Was the Survey flow deleted?
- Survey name - The name of the survey, configured in the Bot Studio.
- Survey description- The description of the survey, configured in the Bot Studio.
- Survey outcome - The outcome of the survey as reported by the Survey bot.
List of Survey outcome supported values:
- “Ignored” when the consumer was offered a survey but didn’t respond
- “Completed” when the survey reached the end of the configured flow
- “Partially completed - timed out” when the consumer answered some questions and then abandoned
- “Partially completed - skipped” when the consumer elected to skip the survey after responding to some of the questions
- “Skipped” when the consumer elected to skip the entire survey before responding to any question
- “Closed by consumer”
- “Consumer unrecognized answer” when the Bot discontinues the survey flow after a max amount of retries
- “Not Supported” if the consumer’s device does not support the new survey flows (SDK incompatible)
- “Closed by system”
- “Error in survey flow” when unexpected errors occur, such as invalid structured content, non-whitelisted images.
Question attributes:
- Question name - The name of the question, configured in the Bot Studio (this is not the question text which is presented in the Question Fallback Text attribute).
- Question type - The type of the question, configured in the Bot Studio. Supported values include: CSAT, NPS, FCR and Custom Questions.
- Question ID - The ID of the question as it appears in the Bot Studio.
- When changing the type, format and name of a question, a new question ID is generated by the system.
- Question fallback text - The text presented to the consumer in case the end-point does not support structured content (such as SMS).
- Question format - The format of the question. Supports the values: “Open” and “Single Selection”. When the Survey flow supports additional format (such as multiple choice), the support values will be adjusted accordingly.
Answers attribute:
- Answer - The answers configured in the Bot Studio for each question.
- Answer value - Hidden attribute (available only to Edit-Access users)
- Is answer recognized by bot - Was the response provided by the consumer recognized as a one of the configured answers for a specific question? Use this attribute to include or exclude the “unrecognized by bot” answer type. Default filter: “Yes” only.
New metrics
Survey metrics:
- Closed survey - The number of survey dialogs which were closed. A closed dialog is one that none of the participants can send messages in.
- Closed survey rate - The percentage (%) of survey instances closed with a specific outcome. Supported by the “Survey Outcome” attribute (filter). * Presents 100% when not filtered / split by outcome.
- Avg. duration of survey availability - The average time a survey is available to the consumer. During this time, the consumer may respond to presented questions. This is measured from the time the survey is offered until the time the survey is closed. Attributed to the Date/Hour during which the survey was offered (not close time of the survey). Format: [h]:mm:ss
Questions metrics:
- Offered question - The number of times a question was offered to a consumer by the bot. A question is considered offered when it is sent by the bot to the consumer in a survey dialog. Depending on the survey flow, a question may be offered more than once to a consumer (cycli flows, retries, etc.).
- Answered question - The number of questions presented to the consumer by the bot and were responded by the consumer with a valid (configured) answer (recognized by the bot as a valid answer). Used to compare with the metric “Offered Question”. When a question is offered multiple times but answered with a valid response less times, there may be an issue with the question text (behavioral or technical).
- Answer rate (offered question) Formula: [Answered Question] / [Offered Question]. The percentage (%) of questions answered with a valid response by the consumer out of the total questions offered to the consumer by the bot.
- Avg. time to respond to survey question - The time on average taken by the consumer to respond to a question. Measured from the time the Bot presented a question, to the time the consumer submitted a response to that question (recognized or unrecognized by the Bot). This is attributed to the time the question was offered (not response time).
If no response was given to the question, the metric will be associated with an empty cell in the dashboard (Null). Format: [h]:mm:ss
Answers metrics:
- CSAT (brand) CSAT (agent and skill) - The percentage of answers “4” or “5” (top two boxes) out of the total responses submitted by consumers to a predefined CSAT question type. Invalid answers, unrecognized by the bot, are excluded from the formula.
- FCR (brand) FCR (agent and skill) - The percentage of answers “Yes” out of the total responses submitted by consumers to a predefined FCR question type.
- NPS (brand) & NPS (agent and skill) - The Net Promoter Score, based on a scale of 0 to 10 and derived from the predefined NPS question type.
- Answer count (brand) & answer count (agent and skill) - The number of times consumers responded with a valid answer, recognized by the bot as a pre-configured answer. Additional buckets include: “Skipped” for questions with configured Skip option and “Unrecognized by bot” for counting how many invalid answers were submitted for a question. This is attributed to the time the survey was offered (not close time).
- Answer ratio (brand) and answer ratio (agent and skill)- The percentage (%) of times consumers chose a specific valid answer out of all the configured answers on a specific question. This may be adjusted to include unrecognized answers by the bot with the filter “Is answer recognized by bot“.
Customized survey answers
Custom calculation for predefined questions (CSAT, NPS, FCR): When using a predefined brick for CSAT, NPS, FCR, you have the option of changing the calculation for the score and defining your own metric, using the submitted answers.
Below is an example for creating a custom formula for CSAT, instead of the precalculated ‘CSAT (Agent & Skill)’ metric. You can use the same syntax and modify it to your needs (use it for the other questions (NPS,PCS) or using a different arithmetic calculation).
Custom metric for CSAT calculation: In order to recalculate the CSAT score, 3 metrics need to be created (see formulas below). The last metric is the one that should be used in grids and visualization (the first two metrics are only for the calculation purposes).
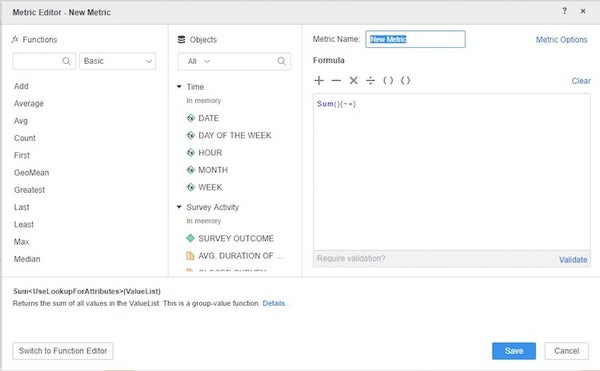
Steps for creating a custom metric:
- On the DASHBOARD DATASETS page at the left side of the screen, right click on ‘survey answers (agent and skill)’ and select ‘create metric.’
- A new pop-up screen ‘metric editor - new metric’ will open up
- Use the ‘metric name’ field to give a meaningful name to the metric
- Paste the formula (copied from the ‘formulas’ section below) into white box at the right.
- Click on ‘validate’ and make sure you receive a green message ‘valid metric formula’.
- Click ‘save’. The formula will be added to the dataset and is ready to use.
- Follow these steps for each of the three formulas listed below.
- Drag the New_CSAT metric into a grid containing ‘agent’ and ‘skill’ attributes, you’ll be able to see the calculated CSAT score.

Formulas:
CSAT_Answer_Count:
- Metric definition: number of times an answer was submitted for Question type=1 (CSAT)
- Formula: NullToZero(Sum(Case(([QUESTION TYPE]@ID=1), [ANSWER COUNT (Agent and Skill)], ZeroToNull(0))){~+})
CSAT_Answer_Count 4_5:
- Metric definition: number of times an answer was submitted for Question type=1 (CSAT)
- Formula: NullToZero(Sum(Case((([QUESTION TYPE]@ID=1)And(([ANSWER VALUE]@ID=4)Or([ANSWER VALUE]@ID=5))), [ANSWER COUNT (Agent and Skill)], ZeroToNull(0))){~+})
New_CSAT:
- Metric definition: the ratio of times answer 4 and 5 where submitted
- Formula: [CSAT_Answer_Count 4_5]/CSAT_Answer_Count
Calculated metrics for custom questions
When using custom bricks in the Post Conversation Survey, you have an option to define your own metric for calculating the results score. The calculation is done using the Question ID (see explanation below), the submitted answer’s text and arithmetic calculations.
Below is an example for creating a custom metric for any type of question with configured answers. The final formula will provide the rate of answers to a specific question (based on the answer’s text) out of the total answers to that question. Follow the steps detailed above, in the predefined questions section, for creating the metrics - this time with the formulas listed below. You can use the formulas syntax and modify it to your needs.
Retrieving question IDs
The IDs of the survey’s questions are mapped between Bot Studio and Analytics Builder.
To In the retrieve the Question ID, head over to Bot Studio and click on the 3 dots next to the question name. Copy the ID and use it in the following formulas.
Formulas:
- Total_submitted_answers
a. Metric definition: number of times any answer was submitted for a specific Question ID (in this example: 52d95264-87d4-453a-bbe0-7b9c12c72bb8)
b. Formula: NullToZero(Sum(Case(([QUESTION ID]@ID="52d95264-87d4-453a-bbe0-7b9c12c72bb8"), [ANSWER COUNT (Agent and Skill)], ZeroToNull(0))){~+})
- Total_submissions_of_specific_answer Metric definition: number of times a specific answer was submitted for a specific Question Answers: Answer’s text contains the words ‘Extremely’ and ‘Satisfied’ Question ID: 52d95264-87d4-453a-bbe0-7b9c12c72bb8 Formula: NullToZero(Sum(Case((([QUESTION ID]@ID="52d95264-87d4-453a-bbe0-7b9c12c72bb8")And(ANSWER@DESCLike"%Extremely%Satisfied%")), [ANSWER COUNT (Agent and Skill)], ZeroToNull(0))){~+})
- Answer’s rate Metric definition: number of times a specific answer was submitted out of the total answers of a specific Question Formula: [Total_submissions_of_specific_answer]/[Total_submitted_answers]
Exporting data for survey answers calculations
Analytics Builder offers the option to export the survey results data into a MS Excel file. You can use this option to create your own calculations using Excel.
Steps for exporting a grid:
- Open messaging performance dashboard
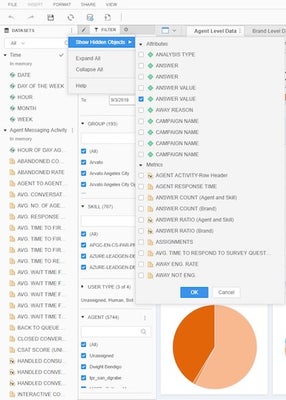
- Unhide 'answer count' attribute:
- On the DASHBOARD DATASETS page at the left side of the screen, click on the down arrow on the right corner of the page
- Select ‘show hidden objects’
- Under ‘survey answers (agent and skill)’, check the checkbox next to ‘ANSWER VALUE’ and click OK
- On the ‘survey data export’ tab, create a new page by clicking the ‘+’ sign at the bottom right corner of the tab
- Drag into the visualization the following metrics and attributes:
Attributes:
- Date
- Skill
- Agent
- Question Name
- Answer value - the submitted answer
Metrics: Answer count (agent and skill) - the number of times the answer was submitted
Export the data into excel by clicking on the down arrow at the top right corner of the visualization, selecting ‘Export’ and ‘Excel’. Now you can use your own formula to calculate the percentage of positive answers submitted out of the totals answers submitted.
Predefined grid
The grid spreads out all the relevant metrics in a granular view so any member on the account may easily download the grid or receive scheduled copies to their email.
Perform the analysis and customization you need using an offline copy, in excel using the complete grid. You can choose the document type (daily/monthly) based on your needed timeframe. The daily grid gives daily aggregations for all the metrics while the monthly grid offers the corresponding aggregations at the monthly level. The data is presented at the brand, campaign and engagement level.
Metrics
For all metrics available within this dashboard please search the Analytics Builder Data Metrics by the name of the dashboard in the Developer Center.
Agent survey
The Agent Survey Chapter includes six pages enabling different analyzes both at the results level, and the survey activity level - understanding how many surveys were submitted and what was the final outcome.
The report will show data at the brand and agent and skills levels. Survey level - allowing to analyze and optimize the configuration of the survey Are the surveys being submitted or skipped\ timed out? Are there surveys that are submitted partially? Question level - allowing to analyze and optimize the configuration of the questions Did agents answer\skip specific questions? Should the wording of the question be improved to increase answer rate? Should the order of the questions be changed?
Answers distribution - allowing to review the survey results Which answer was submitted? How many times is each answer given?
Multiple submissions scenarios
Agent can submit multiple surveys, the metrics will count only the last survey submitted by the agent. An Agent Survey form is opened once an agent is assigned to a conversation with skill that has Agent Survey configured for it.
If the conversation is transferred from the agent to another skill, The next assigned agent will be able to fill the survey if defined for the conversation’s skill.
When conversation is transferred from agent to agent on the same skill (or if agent return the conversation into the queue and the system assigned the conversation to another agent from the same skill), then the Survey will be opened for the 2d agent as well and will be counted twice in the open Surveys Metrics, the 2nd agent can submit the survey as well and it will be counted as well for this conversation.
Conversation may have 2 survey results counted, for example: The conversation starts with skill Billing and assigned to the agent A, then transferred to skill Retention and Agent B submit another Survey. At each skill an agent was assigned and submitted the skill survey, in this scenario the report will count 2 Surveys results and will count twice the opened and completed surveys
Attribution to agents
Survey results are attributed to the last agent that submitted the Survey on that Skill. Conversation may have more than one Survey counted, pending on the number of skills the agents completed.
Time attribution
All metric results are aligned to the time the surveys were opened to allow understanding the Survey funnel.
Survey data is collected after a survey is changed (opened, subm,submitted, closed ) either by agent submission or by Survey Timeout. Meaning that activity or results for a survey which is still open will be counted as open and only after the survey is closed it will be counted as one of the survey outcomes.
The data is collected for closed surveys and survey results are associated with the time the survey was open.
Aggregation levels
The KPIs on the dashboard can be analyzed on three aggregation levels:
- Brand
- Agent and skill
- Agent Survey
- Question level
Primary filters
The survey data can be filtered by - skill, survey name, survey outcome (completed, ignored, skipped, …).
Pages
The sheet contains five Pages in a single sheet
- Agent Survey summary - high level brand and skill survey completion analysis
- Survey Funnel - Weekly & Daily Survey completion analysis
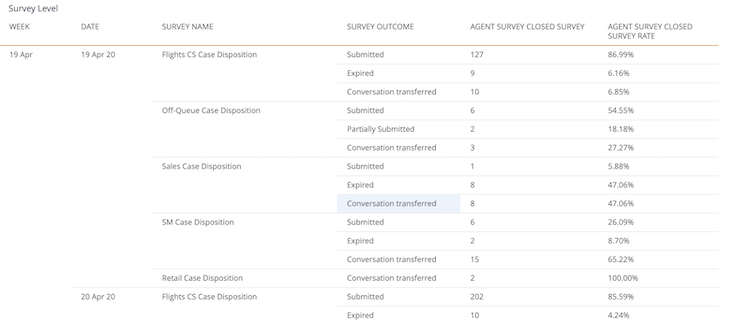
- Survey Level -Daily Survey Completion analysis
- Answer Distribution (Brand)
- Answer Distribution( Agent and Skill) - Answer distribution by Agent and Skill
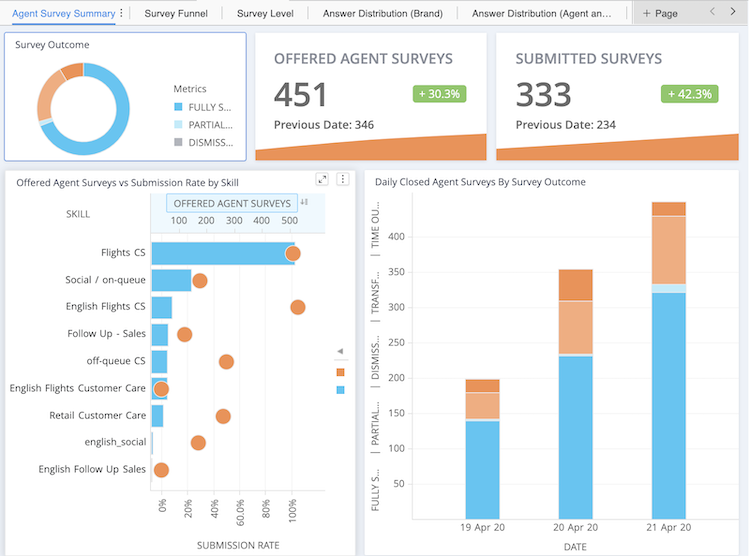
Main Page: Agent Survey summary
The main page provides an analysis of the overall survey activity, focused on Survey Outcome.

Page 2: Survey Funnel - Weekly & Daily Survey completion analysis grid.

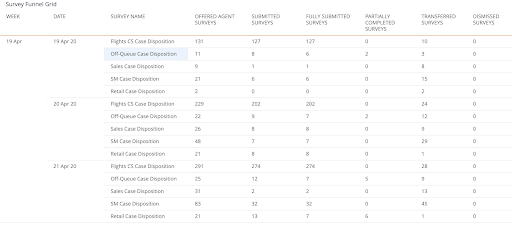
Page 3: Survey Funnel - Daily Survey Completion analysis by Survey Outcome

Page 4: Answer Distribution (Brand)

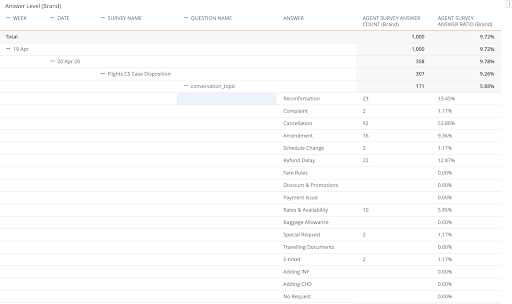
This page lists every configured question and answer-option, including a count of times an answer was selected.
Page 5: Answer Distribution( Agent and Skill) -
This page lists every configured question and answer-option, including a count of times an answer was selected by skill and agent.
If a conversation had 2 agents submitting surveys, The report will show both of them. If an agent submitted more than one survey to the same conversation and skill, the last submitted survey results will be counted.
Page 6: Predefined Question Answer Distribution (Brand)
Agent Survey metrics
Survey Funnel Metrics
- OFFERED AGENT SURVEYS - All surveys that were presented to the Agent, no matter how it ended (dismissed, timeouts, submitted ,transferred).
- SUBMITTED SURVEYS - All Survey forms that were submitted (partial or complete), submission will be counted as one per conversation even if submitted more than once.
- FULLY SUBMITTED SURVEYS - All Survey forms that were fully submitted, submission will be counted as one per conversation even if submitted more than once.
- PARTIALLY COMPLETED SURVEYS - Number of Survey forms that were partially completed.
- TRANSFERRED SURVEYS - The number of survey forms transferred to another skill before the survey form submitted.
- TIME OUT SURVEYS - The number of open survey forms that are automatically closed based on brand specific survey timeout.
- DISMISSED SURVEYS - The number of survey forms dismissed by an agent. This is only applicable if the survey has non-required questions.
- SUBMISSION RATE - The percentage (%) of submitted survey forms (partial or complete) out of the number of opened survey forms
Survey Answers Metrics
- AGENT SURVEY ANSWER COUNT (Agent Skill) - The number of times an Agent provided answers to questions. Calculated at the Agent and Skill level
- AGENT SURVEY ANSWER COUNT (Brand) - The number of times an Agent provided answers to questions. Calculated at the Brand level.
- **AGENT SURVEY ANSWER RATIO (Agent Skill) ** - The percentage (%) of questions answered by an agent out of the total questions answered.Calculated at the Agent and Skill level.
- AGENT SURVEY ANSWER RATIO (Brand) - The percentage (%) of questions answered by an agent out of the total questions answered. Calculated at the Brand level.
- AGENT SURVEY CLOSED SURVEY - The number of survey forms that were closed (1.Submitted - The agent submitted the survey at least once. 2. Partially submitted - Only some of the answers were completed and the survey was submitted by the agent, 3. Time Out - Agent did not complete any answers and there was a time out by the system. The agent did not submit the survey AND did not click the Dismiss Button . 4. Conversation transferred - Agent performed transfer to skill option which closes the survey and opens a new one, no matter what the previous Agent did, 5. Dismissed - The agent pressed the dismiss button, in a non-mandatory survey).
- AGENT SURVEY CLOSED SURVEY RATE - The percentage (%) of survey forms closed with a specific outcome. Supported by the Survey Outcome attribute (filter).
New attributes / filters
Survey attributes
- SURVEY TYPE - Type of survey form. Values include: Post-Chat, Agent Survey.
- PREDEFINED QUESTION NAME - Agent Survey Predefined question (conversation topic, conversation outcome, engagement attributes).
Limitations
Free text questions can not be analyzed with Report Builder
Missing Something?
Check out our Developer Center for more in-depth documentation. Please share your documentation feedback with us using the feedback button. We'd be happy to hear from you.