Getting started with Insights
Accessing Insights
Access to Insights is strictly by request - speak to your account manager to discuss pricing and enablement.
Once the account is set up and data has been loaded, please e-mail insights-lp@liveperson.com and provide a list of users (names and emails) who will need access to the tool. Each user will receive an email with instructions to create login access . The email will be ‘Welcome to Advanced Insights’ coming from no-reply@liveperson.net. The link will expire in 24 hours so it is important to set up the account within that time frame. Once the account is set up, save the URL for future access. Note the tool is only compatible with Google Chrome.
Getting Started with Insights
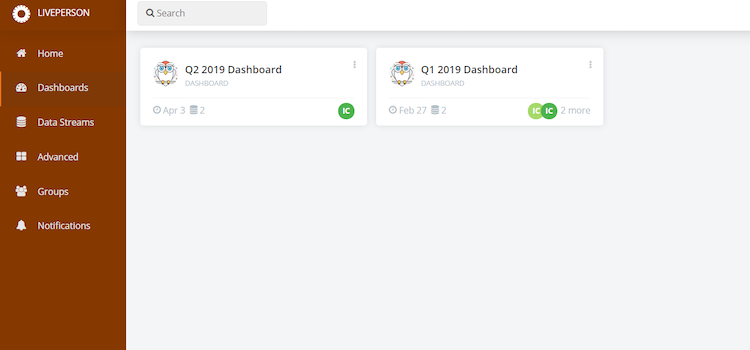
Insights is a stand alone application and is independent of the LivePerson Conversational Cloud. Your URL is unique to your brand. When you log in, you will see several tabs on the right:
- Home: shows any recent activities in your portal
- Dashboard: shows all the dashboards that you created or dashboards that have been shared with you
- Data Streams: raw data file; you will only see them if they been shared with you
Advanced:
- Taxonomies - you will see all the taxonomies you created and the ones shared with you
- Sentiment - you can tune the sentiment score for words
- Stopwords - you can add words that you want to discard from machine learning word cloud
- Chinese tokens - Provide a set of chinese words that you want the system to process together as one word
Groups: you can create groups if you want to a particular set of users to have only certain access Notifications: shows details of changes made in dashboards
To get started, click on the Dashboard tab to start creating a dashboard or to view existing dashboards shared with you.

Glossary
- Bigram - A pair of grammatically related words found in the text
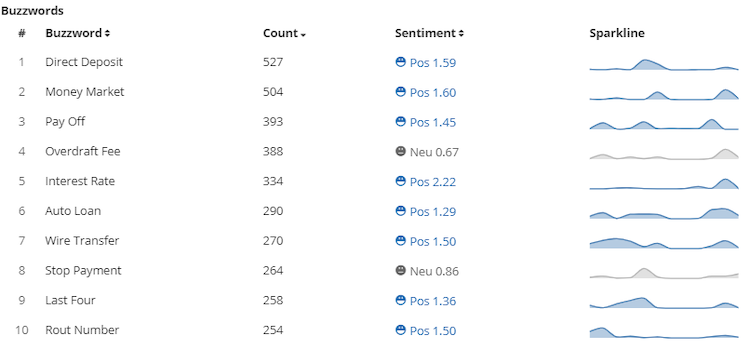
- Buzzwords - Pairs of related words found in the text
- Consumer Intent - The customer’s goal for his/her interaction with the brand Consumer Journey - The set of experiences a customer has when interacting with a brand Conversion Sale or other brand - defined consumer event (lead generated,
- CSAT - Customer Satisfaction – a survey score based on question(s) defined by the brand
- Data Stream - Set of transcript data, packaged quarterly or monthly
- Emerging Trends - Topics identified by Insights Natural Language Understanding engine. The widget may also include date trends for the topics
- ETL - Export, Transform and Load – the process Insights uses to make copies of transcripts, format them and store them in the Insights database
- KPI Key Performance Indicators – metrics identified by a brand as important business drivers
- NLU - Natural Language Understanding – Insights underlying technology used to review your chats or messages to identify conversation topics
- NPS Net Promoter Score – a loyalty measurement designed to identify consumer loyalty. It compares the percentage of customers who are considered Promoters (high survey scores) with those considered Detractors (low survey scores)
- Semantic Topic - A small set of word pairs (bigrams) that frequently occur together.
- Sentiment - Tone, as identified by Insights Natural Language Understanding engine.
- Sparkline - A graphical depiction of the volume of mentions of the word pair over time
- Taxonomy - Topics categorized by – hierarchical list of industry-specific conversation topics, curated by human analysts
- Unstructured Data Data type including text and geolocational (place)
- Verbatim - Conversation text that may be grouped by speaker (customer, agent, bot) or source
- Widget - Individual data visualizations on an Insights dashboard
Use Case Examples
What are the top Conversation Topics?
- Navigate to the Consumer tab on the dashboard
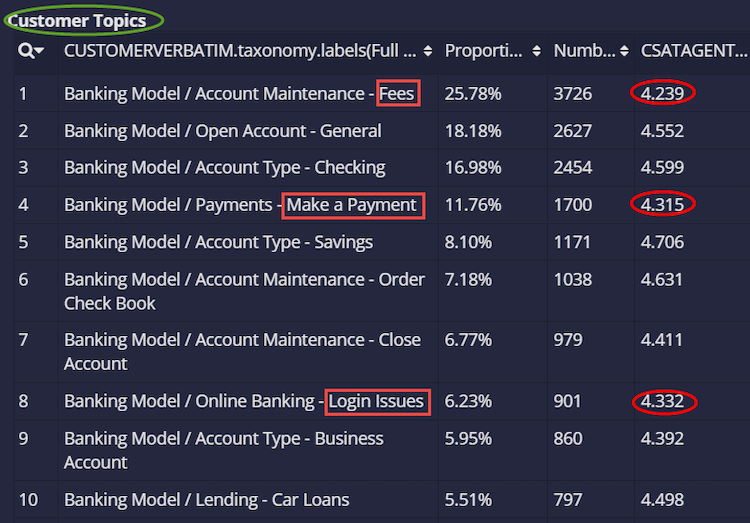
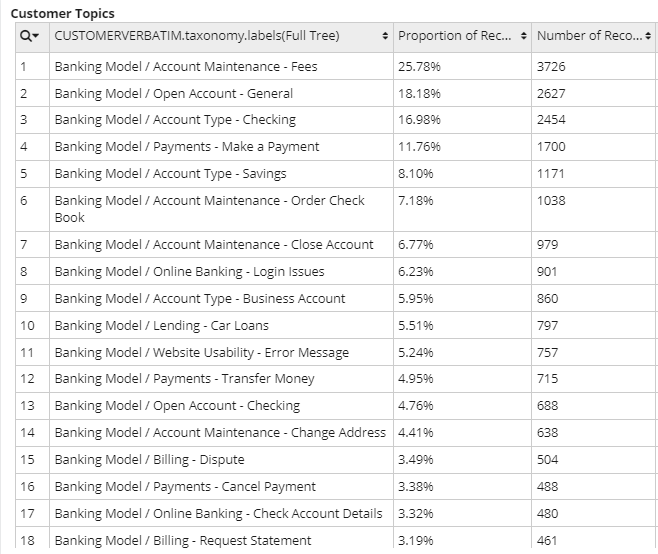
- Locate the Customer Topics Widget
- This widget shows all Customer Chat topics, number and proportion of records and associated metrics (e.g. CSAT)
- Clicking on the sort arrows next to proportion of records allows you to view the list in descending order, showing the Topics in order of volume
Which topics don’t perform as well as others?
- Repeat the above process to view the Top Topics
- Click on the Overview tab to find your Average metric scores (e.g., CSAT)
- Within the Customer Topics widget within the Consumer Tab, you can view which Top Topics have scores above / below the average
- In the example below we can see that Fees, Making Payments and Login Issues all perform less well than the average CSAT Score (4.36)

Who are the top and bottom performing agents?
- Repeat the above process to find your Average metric scores (eg CSAT)
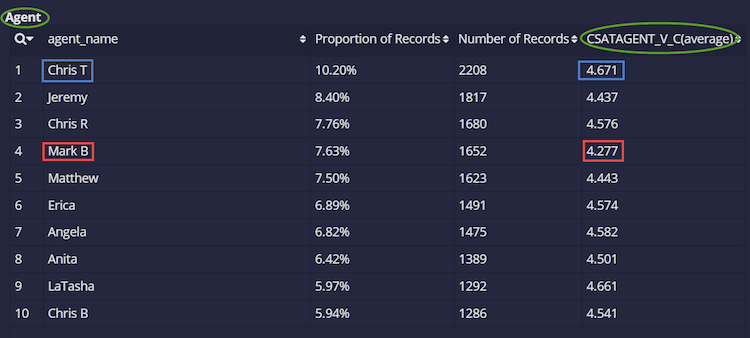
- Navigate to the Agent Tab on the dashboard
- Within the Agents widget within the Agent Tab, you can view which Agents have scores above / below the average
- In the example below you can see that Chris T (4.671) has the highest average CSAT score, whilst Mark B (4.277) is the only agent in the Top 10 with a CSAT score below average (4.36)
- By filtering on specific topics (by clicking on a topic in the Consumer Topic widget as above) you can further drill down into the types of conversations that are resulting in higher or lower Agent CSAT scores
- To see Conversation Examples, look at the chat examples widget. Click on example boxes to reveal the full transcript

How to filter by bot and view topics that the bot is handling
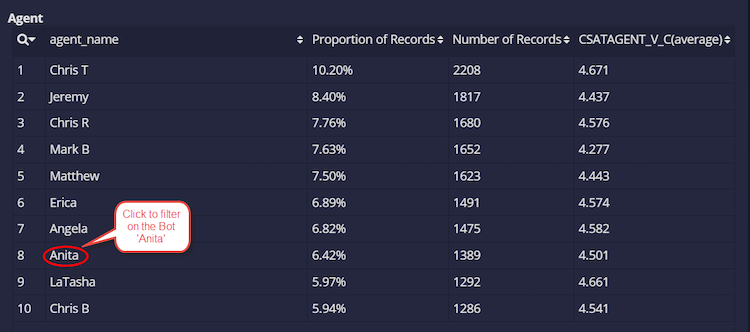
Apply a BOT Filter to the dashboard by selecting the relevant Agent(s) or Skill(s) according to your brand
- To Select an individual Agent, click the agent name on the Agent Widget

- To Select an individual Skill, click the Skill name on the Skill Widget

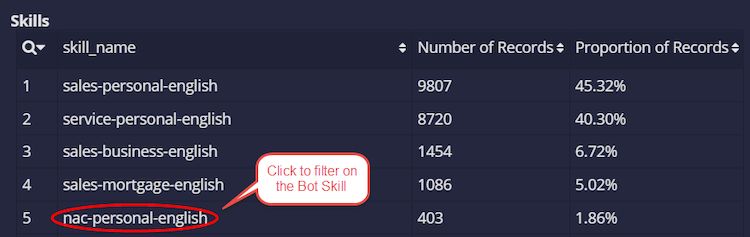
- To Select multiple Agents (e.g. Angela and Anita) or Skills in a filter, refer to the Filter guide here Follow the above processes to identify the top topics and which topics are performing better than others.
Where are chats/messages initiated from?
Using Insights, we have the ability to identify the page a conversation started from for chat or web messaging.
- Open dashboard
- Most dashboards will have a tab called “Website”. If that tab exists, select it
If the tab does not exist, you can create a widget to show where chats are initiated from by:
- Click on the + sign on the bottom right corner
- On the left side there will be a list of attributes and select “start_url” (for chats) and “conversationstartpage” (for web messaging)
- If you want volume, volume % and any metric you will need to select number of records, proportion of records and any metrics (ie. CSAT, NPS, FCR, duration_min) respectively
- The widget will list all the URLs where chats were initiated from Note: the system will only select the first 200 URLs by default
- If you are looking for more than 200 results then click on the “+” on the bottom right corner and on the bottom page there is a box called “Amount Shown”. You can change the Amount Shown to more or less than 200. Best practice is to show only 200 because the numbers of records for each site does decrease significantly after that.
- if you increase the amount too much i.e. 500, it will slow down the system because it has to pull many more results.

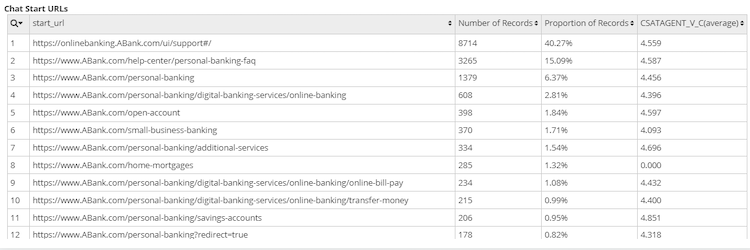
Start URL/Conversationstartpage: URL where chats were started Number of records: number of chats or conversations that were initiated from the URL Proportion of records: percentage of chats or conversations that were initiated from a specific URL CSAT or any metric: score customer gave during exit survey
What did customers chat/message about from a specific URL?
Looking at the start URL widget, select any URL for analysis by clicking on it. That filter will then apply to the whole dashboard.
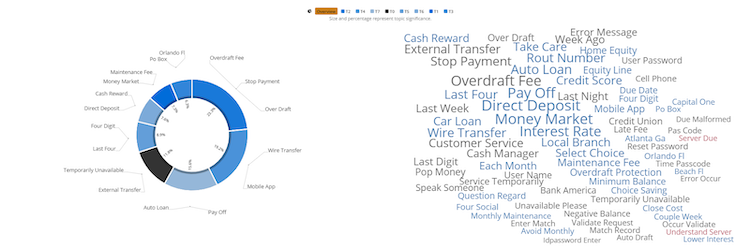
Within the customer tab, there are two ways to understand what the customer chatted/messaged about: Unsupervised Machine learning which shows customers’ trends and if the program has one created for the data set then also a customized taxonomy
Customer Machine Learning:
In the example above, customers mention direct deposit in 527 chats followed by money market in 504 chats. You can filter any of the words in the word cloud or list; that filter will apply across all tabs and widgets. Machine Learning shows the most commonly paired words that customers use and also an indicator of emerging trends.


Customized Model:
To identify pain points, you can look for the chat topics that were below CSAT average or conversations that lasted longer than average. For example, if your overall CSAT average was 4.2 then you can look for topics that were below 4.2; if your average chat duration was 15 minutes then focus on chats that were more than 15 minutes to understand why those topics are lasting so long.
When sorting CSAT, please keep in mind the volume; CSAT might be very high but volume might be low so best practice is to focus on top 20 conversation/chat topics.
To see chat/conversation examples, look for the conversation example widget. Each box is a conversation/chat and you can see the full conversation by clicking on it. The pop up will have all the structure data and also the full transcript.

What are the chat/message topics by device type?
In most dashboards there is an overview tab, and in the tab there is a widget that breaks out device type
If the tab does not exist, you can create the widget to show where conversations are initiated from by:
- Click on the + sign on the bottom right corner
- On the left side there will be a list of attributes and select “device_family”
- If you want volume, volume % and any metric you will need to select number of records, proportion of records and any metric (ie. CSAT, NPS, FCR, duration_min) respectively
- First click on device you want for analysis and the filter will be applied across the whole dashboards and all the widgets
- Under the “Customer” tab, you will find the Unsupervised Machine Learning and customized Taxonomy. Both views will represent what customers chatted about during a conversation.
Taxonomy:
To perform another device analysis, go to the bottom of the page and hover over device_type and click on x to remove the filter. Go back to the device widget and select another option.
Missing Something?
Check out our Developer Center for more in-depth documentation. Please share your documentation feedback with us using the feedback button. We'd be happy to hear from you.