Creating new widgets
What is A Widget?
Insights Dashboards can contain several ‘tabs’, each containing several ‘widgets’. Widgets are visualisations of data dimensions in the form of tables, lists or charts. Common visualisations include:
- Bar / Line Charts to represent volume of conversations over time
- Pie Charts to show proportions of conversations by device type (eg mobile/phone/desktop)
- Tables to list skill names / agent names and associated metrics (eg CSAT)
Creating a New Widget
Note: If you have ‘view only’ access to dashboards, widgets will not be saved once you exit the dashboard. To check / update your permission rights, contact your LP Insights representative.
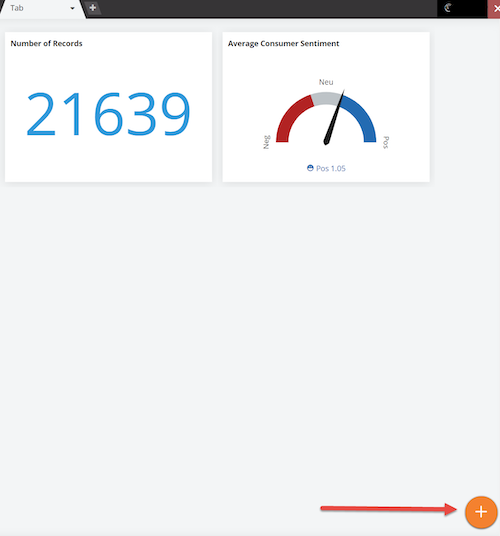
To create a new widget, first click the big PLUS SIGN button in the bottom right of any tab in a dashboard.

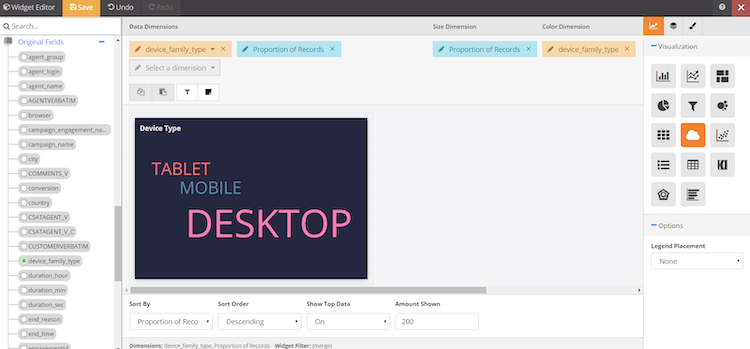
This opens the Widget Editor, allowing you to select data dimensions and visualisations for a new widget.


- In the List of fields that appear on the left, select a field.
- Note that when you select a field:
- The selected field appears under Data Dimensions.
- The default visualisation type for the data type of the selected field appears in the middle space and populates with data.
- The Visualisation section to the right updates to show only those visualisation types that you can use with the selected field.
- An Options section appears below the Visualisation section, showing any options that apply to the selected visualization type.
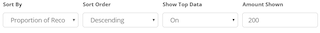
- A sort section at the bottom of the editor allows you to sort by a chosen field, in ascending or descending order.

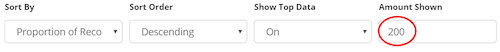
- The default ‘amount shown’ is 200. When you view / export data, the top 200 records will be retrieved. This number can be increased (or decreased) as required. It is best practice to keep this number as low as possible to keep dashboards loading times optimal.
- Note that clicking on the field allows you to edit the aggregation (e.g., average, sum etc.), format (number type) and whether the field is numerical or textual
- Repeat the above for desired fields. Widgets typically include the fields ‘number of records’ and / or ‘proportion of records
- To finish setting up the widget, click Save on the top left
Common Visualisations:
Click here for the visualisations.
Widget Menu
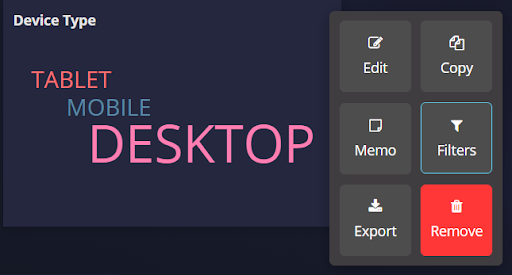
Clicking on the menu bar in the top right of any widget brings up a menu to Edit, Copy, Filter, Export or Remove the Widget. If you are designated as a ‘view only’ user, any changes made to the dashboard will be erased once you exit out of the dashboard. The administrator of the dashboard controls permissions.

Copying Widgets
Click Copy from the menu in the top right corner of a widget. Right click anywhere within any tab of the dashboard to paste the copied widget
Editing Widgets
Click Edit from the menu in the top right corner of a widget. This opens the Widget Editor, allowing you to amend the data dimensions and visualisations required for the widget. The editing process is the same as the add widget process detailed above.
creating new widget insight 7
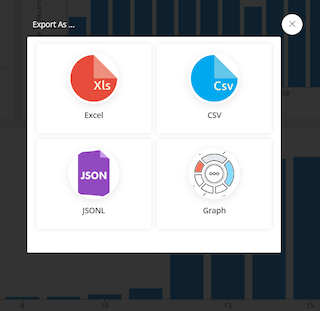
Exporting Widgets
Click Export from the top right corner of a widget. From here you can export the contents of the widget in a variety of formats, including Excel or Graph (image) format. When exporting a List visualisation, this will export the number of records set under Amount Shown at the bottom of the Widget Editor. Note some visualisations (eg Word Clouds) can be exported as an image only.

Sorting within a Widget
At the bottom of the Widget Editor, you can select the primary dimension you wish to sort on, in either Ascending or Descending Order. You can also sort on any dimension in a list by clicking the up/down triangles to the right of each dimension displayed in a widget

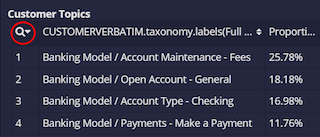
Searching within a Widget
Clicking on the magnifying glass in the top left of a widget displaying a list visualisation, opens a search bar. Here you can search within a particular field or ‘Any Field’.

Missing Something?
Check out our Developer Center for more in-depth documentation. Please share your documentation feedback with us using the feedback button. We'd be happy to hear from you.