Creating dashboards
Users with edit permission will be able to create new dashboards.

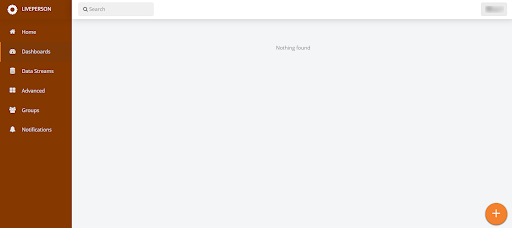
1. From the Home page within the Dashboards section, click the Add button.
2. Name the dashboard

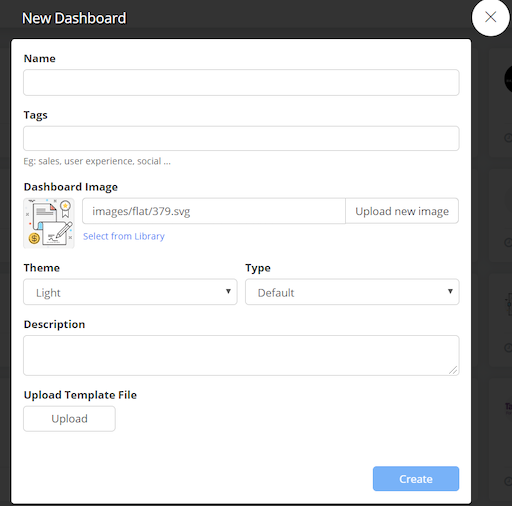
a) Tags - Enter tags to categorize dashboards for future use as templates.
b) Dashboard Image - Upload a logo or other image from your computer, or select from the extensive library of images to represent the dashboard.
c) Theme - The Light theme is selected by default, with a grey background and white widgets, but you can choose the Dark theme to use a black background and dark grey widgets.
d) Type - Change the Default value to Template to save the dashboard as a template that others can use.
e) Description - Provide a description of the dashboard contents.
3. Select a data stream (note: you will only see data streams that have been shared with you).
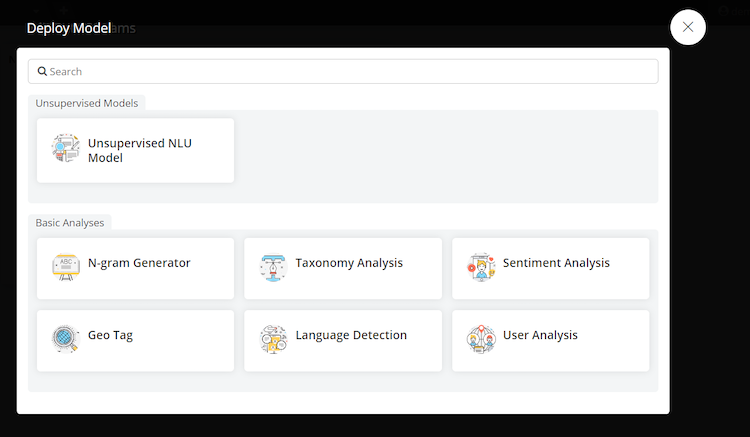
4. After selecting a data stream, you can deploy a Taxonomy Analysis model

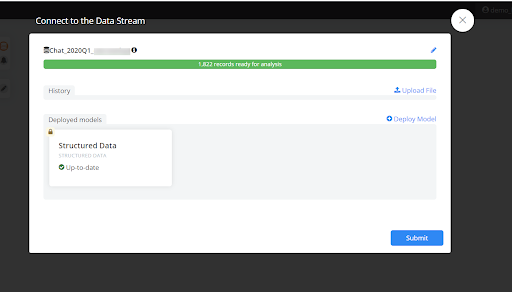
5. After clicking on deploy model, you can choose Unsupervised NLU Model or Taxonomy Analysis

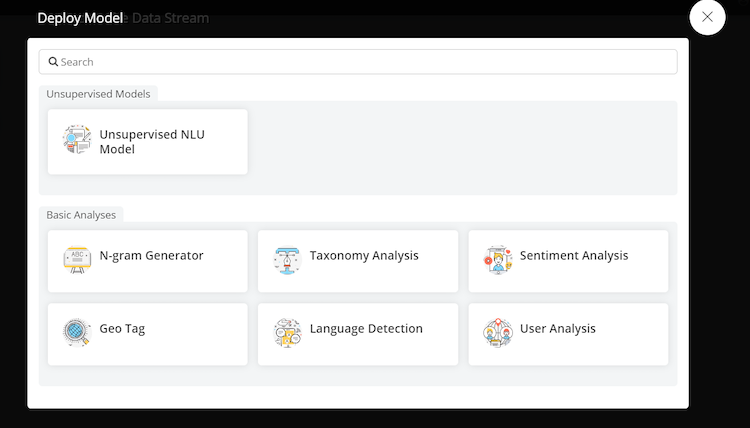
N-gram generator - This analysis goes through the chats/conversations and pulls out buzzwords which are based on their frequency in all of the verbatims. It generates a buzzword word cloud
Geo Tag- It creates a geo map based on the user’s IP address location (if IP address is included in your data).
Language Detection - identifies the languages being used in the transcripts
Sentiment Analysis - provides an average sentiment score for the entire verbatim
User Analysis- this is to determine the gender of the user (Insights does not recommend using this analysis for our type of data)
Deploying a Taxonomy:


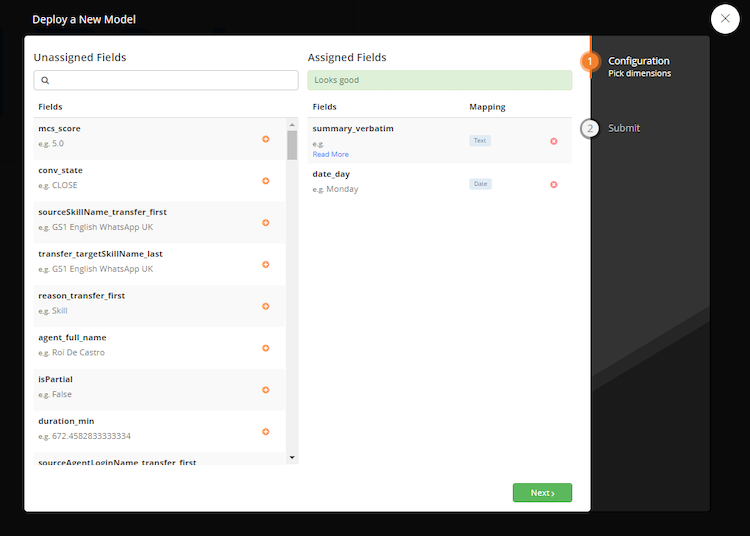
1. Choose Taxonomy Analysis
2. Choose the type of verbatim (customer, agent, or bot) you would like to analyze from the list on the left side, run this as your text field. Click next.

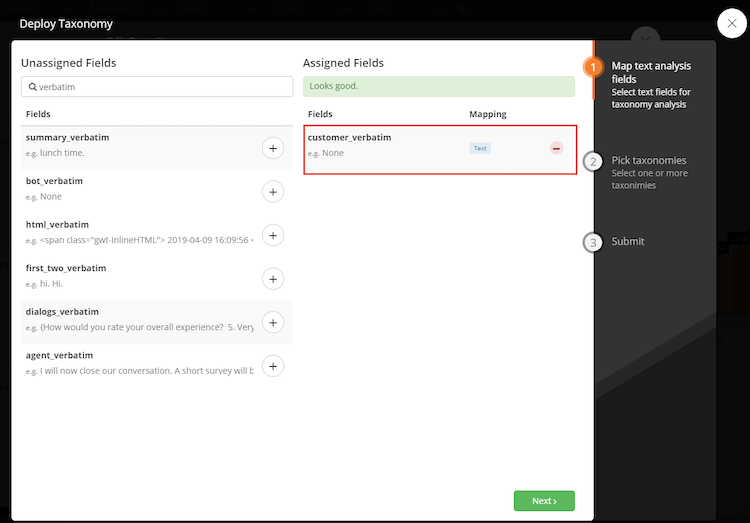
3. Click the blue + button to select the taxonomy to use:


4. Select a taxonomy from this list and click apply

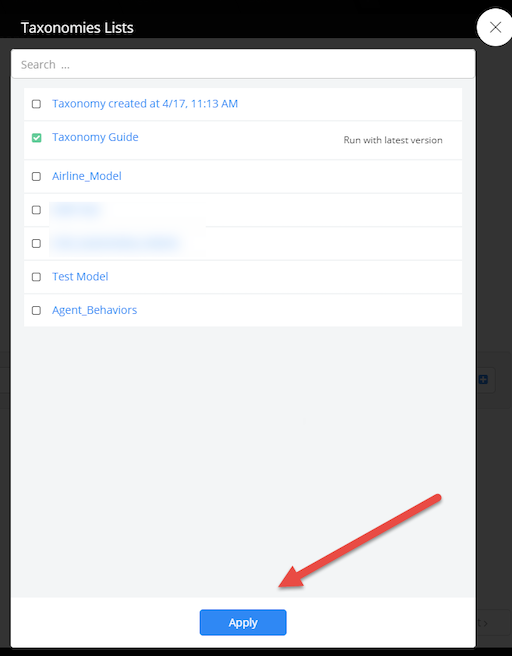
5. Name your taxonomy analysis and click submit
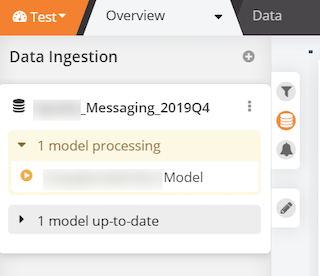
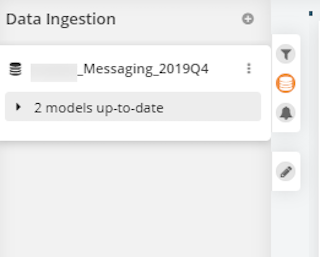
6. Once the model starts processing, you will see a message that says“1 model processing.” When the model finishes processing, you will see a message that says “1 model up-to-date”.

Deploying an Unsupervised NLU Model
1. Choose Unsupervised NLU Model

2. Choose the type of verbatim (customer, agent, or bot) you would like to analyze from the list on the left side and then click on the plus sign and choose text

3. Change the name of the Unsupervised NLU Model to include the type of verbatim you are analyzing and click Submit
4. Choose Submit again
5. Once the Unsupervised NLU Model starts processing, it will say “1 model processing”

6. Once processing is complete, it will say Models up-to-date on the left side

Click here to learn how to navigate an Insights dashboard.
How to copy an existing dashboard
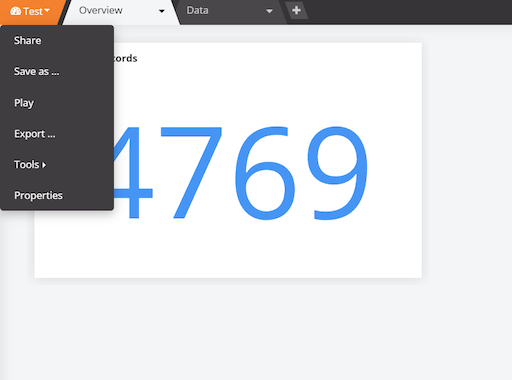
1. To make a new copy of an existing dashboard, open the dashboard you want to copy
2. On the top left corner, choose “Save As”
3. Give the new dashboard a different name and now a copy of the dashboard has been created.

Note: only you can see the new dashboard. If you want other users to view it, then you need to share it. To learn how to create a new widget, click here
Sharing dashboards
Sharing Dashboard with a Group
Dashboards can be shared with individuals or user groups
1. Click on Dashboards to see all the dashboards
2. Click on the bottom right corner of the dashboard to start sharing
3. The dashboard can be shared with users by searching their e-mail in the search bar. Once an e-mail is added to the account, the user can have different user rights. If a user group is already there, then you can see what type of user right that group can have.
4. Click on “Owner” to see all options
- Can View: users can view widgets but cannot permanently modify it.
- Can Edit: can view and modify the dashboard, but cannot share it with others.
- Can Share: can edit and share the dashboard with others, but cannot remove others’ access.
- Owner: can edit, share, and add or remove users with less privilege.
5. Once a user right is selected, click “+” so that group/user has access to the dashboard.
Missing Something?
Check out our Developer Center for more in-depth documentation. Please share your documentation feedback with us using the feedback button. We'd be happy to hear from you.