Business dashboard for messaging
The business dashboard for messaging provides a daily snapshot of campaign performance, allowing brands to analyze the campaign funnel for messaging engagements. Using this dashboard, you can identify opportunities to grow your reach and boost service availability by extracting actionable conclusions based on the consumer’s journey through the brands website, and other engagement sources. This dashboard reflects consumer demand as well as how successfully the campaign was set up on the account. You can utilize this dashboard to optimize your campaign targeting and engagement routing.
Brands are able to view messaging data at the Brand, Line of Business, Campaign, Engagement and Entry Point levels for funnel metrics.
Primary datasets:
- New aggregation model (currently known as Agent Messaging Activity)
- Conversion Daily
- Conversion Daily- Brand
- Visits Daily
- Exposures Daily - Brand Distinct
- Exposures Daily - LOB Distinct
- Exposures Daily - Campaign Distinct
- Exposures Daily - Engagement Distinct
- Exposures Daily - Entry Point Distinct
- View and Accepted Offers Daily
- Consumer Messaging Activity
- Agent Activity Hourly
Primary filters:
- Date
- Group
- Initial device: desktop/laptop, mobile smartphone, mobile tablet
- Campaign's goal
- Campaign goal type
- Source Type: Web, Brand App, Twilio SMS, Facebook, Apple Messages for Business, Google, Line
Manual filter by Panel:
- Campaign
- LOB
- Entry Point
- Engagement
Minimum time frame: Daily
Understanding funnel metrics (aggregation levels and distinct counting)
Aggregation Levels
The business funnel can be analyzed from several different aspects. The Business Activity dashboard offers a view into 4 of these: Site, Line of Business, Campaign, and Engagement. At each level, the metrics included in the business funnel are pre-aggregated to reflect the corresponding aspect.
A suffix has been added to each metric name to allow users to identify the level to which the metric is pre-aggregated. For example: “PROSPECTS (CAMP)” and “EXPOSED (LOB)”.
Important to note that the funnel is aligned to the Visit session start time. This means that the date filter set on the dashboard applies to all visits starting within the selected range, including the events which occurred for the entire duration of the retrieved visit sessions.
Distinct metrics
Each funnel metric is assigned to a distinct level, which indicates the consumer experience. There are two distinct levels in the Business Activity dashboard: visitor-session and engagement.
- Distinct per visitor session will add 1 to the metric results when a defined event occurred during the visit.
- Distinct per engagement will add 1 to the metric results when a visitor was exposed to a specific engagement. The following list contains the distinct metrics and their underlying formula (where applicable): Distinct to visit
- PROSPECTS - Number of visits that were eligible to receive at least one engagement. Includes control group visitors if defined in the account
- EXPOSED -Number of visits during which the visitor was offered an engagement
- ENGAGED - Number of visitors who had at least one engagement during their visit Distinct to Engagement
- EXPOSURES - Number of times each engagement was offered to a visitor
Reporting on campaigns funnel from messaging engagements
The business funnel is open to engagements from all sources, including those originating from the Mobile app. The primary difference between tracking the funnel from a website (for Web Messaging) and from a Mobile app is the automated manner in which the funnel metrics are populated.
The LivePerson monitoring code present on your website pages automatically transmits to the Conversational Cloud each step in the consumer’s journey. This translates into metrics included in the Business Activity dashboard. In order to integrate consumer journeys taking place in the mobile app into Campaign Funnel metrics, the use of an SDK is required (read more on how to integrate your app with Campaigns).
The following diagram outlines how funnel metrics are calculated for Messaging Engagements which do not originate from a monitored web source:
Counting “sessions” from the Mobile App
The the Conversational Cloud platform manages consumer activity through “sessions”. A visitor (aka “consumer”) session on a website begins when the visitor enters a webpage monitored by the web tag. In most cases, a session ends when the visitor navigates out of the website or closes the browser completely.
Throughout the session, funnel events are transmitted to the Conversational Cloud from the tag present on the web pages.
Similar to the activity on the website, the Conversational Cloud will initiate a session when the mobile app requests a Campaign and Engagement in order to start the in-app conversational experience. This will result in an increase in the SESSIONS metric.
Conversions from the Mobile App
The Business dashboard offers a significant number of metrics which track conversions.
The Conversational Cloud campaign funnel ends with a successful assisted conversion. An assisted conversion is achieved during or after a conversation with an agent. The mobile app, similar to the website, should report an Engagement Attribute which triggers a campaign goal.
In-session vs. cross-session conversions: A campaign goal achieved during an ongoing session (as explained in the previous section here) is considered an in-session conversion. In order for an in-session conversion to be registered, the mobile app should report on the corresponding Engagement Attribute within 6 hours of the conversation initiation. Beyond 6 hours and with respect to the cross-session window setup in the Conversational Cloud, the conversion will be considered cross-session.
An App Messaging conversation may continue beyond 6 hours and is not coupled with the monitored session managed by the Conversational Cloud.
Attribution of conversions to agents: Conversions from the mobile app are either attributed to the first agent of the conversation, or the last. This model is similar to conversions tracked on your website, and is set up via the Conversational Cloud campaigns settings.
Main sheet: Business Activity analysis
Corresponding to the aggregation levels presented in the above section, the predefined main sheet of the Business predefined dashboard contains a panel for each aggregation level. The metrics are not identical across all panels. Brand, Campaign, Engagements have the same funnel at their aggregated level. LOB and Entry Point do not contain any information following an opened conversation.
Common to all panels
There are four available panels in this dashboard: Brand, LoB, Campaign, Engagement and entry point.

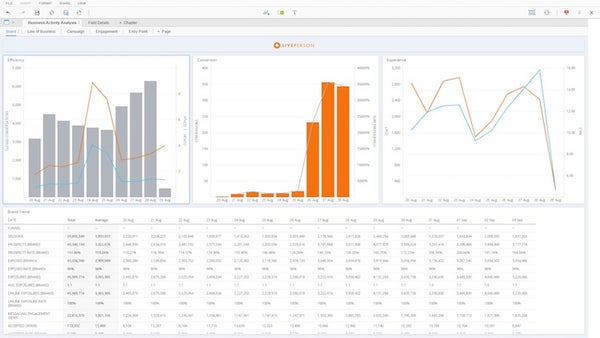
Top data bar (Grid)
Columns (Metrics):
- PROSPECTS
- EXPOSED
- ENGAGED
- ENGAGEMENTS
- TOTAL GOALS REACHED AFTER ENGAGEMENT
- TOTAL CONVERSIONS AFTER ENGAGEMENT
| Graph Name (Type) | Vertical (Metrics) | Horizontal (Attributes) |
| Prospects(bar chart - main axis) | PROSPECTS | WEEK |
| Exposed | EXPOSED(bar chart - main axis) | WEEK |
| EXPOSED RATE(line chart - secondary axis) | N/A | WEEK |
| Engaged | ENGAGED(bar chart - main axis) | WEEK |
| ENGAGED RATE(line chart - secondary axis) | N/A | WEEK |
| Conversions | TOTAL CONVERSIONS AFTER ENGAGEMENT(bar chart - main axis) | WEEK |
| INCREMENTAL CONVERSION RATIO(line chart - secondary axis) | N/A | WEEK |
Trend (Grid)
Rows (Attributes): Date, Total, Average
Columns (Metrics):
Funnel metrics
- ABANDONED CONVERSATIONS
- ABANDONED RATE
- ACCEPTED OFFERS
- ACCEPTED RATE (BRAND)
- AVG. CONSUMER RESPONSE TIME
- AVG. CONVERSATION DURATION AVG. EXPOSURES (BRAND)
- AWAY
- AWAY RATE
- BACK SOON
- BACK SOON RATE
- BACK TO QUEUE TRANSFERS
- CLOSED BY AGENT RATE
- CLOSED BY CONSUMER RATE
- CLOSED BY SYSTEM RATE
- CLOSED CONVERSATIONS
- CLOSED CONVERSATIONS PER LOGIN HOUR (Metric name for graphs is ""CCPLH"". Metric name for grids is ""CLOSED CONVERSATIONS PER LOGIN HOUR"")"
- CLOSED CONVERSATIONS PER ONLINE HOUR
- (Metric name for graphs is ""CCPOH"". Metric name for grids is ""CLOSED CONVERSATIONS PER ONLINE HOUR"")
- CONVERSATION OPEN RATE
- TOTAL CONVERSIONS PER ONLINE HOUR
- CSAT SCORE (UNIFIED)
- MESSAGING ENGAGEMENT VIEWS
- EXPOSED (BRAND)
- EXPOSED RATE (BRAND)
- EXPOSURES (BRAND)
- HANDLED CONVERSATIONS
- INCREMENTAL CONVERSION RATIO (BRAND)
- INCREMENTAL CONVERSIONS (BRAND)
- INTERACTIVE CONVERSATIONS
- INTERACTIVE RATE LOGGED IN TIME
- MCS
- NO. OF CONVERSATIONS CLOSED BY AGENT
- NO. OF CONVERSATIONS CLOSED BY CONSUMER
- NO. OF CONVERSATIONS CLOSED BY SYSTEM
- NO. OF OPENED CONVERSATIONS ONLINE ONLINE EXPOSURE RATE (BRAND)
- ONLINE EXPOSURES (BRAND)
- ONLINE RATE PROSPECTS (BRAND)
- PROSPECTS RATE (BRAND)
- TOTAL DIRECT REVENUE PER ONLINE HOUR SESSIONS
- SKILL TO SKILL TRANSFERS
- TOTAL CONVERSION RATE AFTER ENGAGEMENT
- TOTAL CONVERSIONS AFTER ENGAGEMENT
- TOTAL DIRECT AOV AFTER ENGAGEMENT
- TOTAL DIRECT AOV AFTER EXPOSURE
- TOTAL DIRECT AOV AFTER EXPOSURE NOT ENGAGEMENT
- TOTAL DIRECT REVENUE AFTER ENGAGEMENT
- TOTAL DIRECT REVENUE AFTER EXPOSURE
- TOTAL DIRECT REVENUE AFTER EXPOSURE NOT ENGAGEMENT
- TOTAL NO. OF TRANSFERS
Goals metrics
- TOTAL GOALS REACHED AFTER ENGAGEMENT
- TOTAL GOAL REACHED RATE AFTER ENGAGEMENT
- TOTAL CONVERSIONS AFTER ENGAGEMENT
- TOTAL CONVERSION RATE AFTER ENGAGEMENT
- TOTAL CONVERSION RATE AFTER EXPOSURE NOT ENGAGEMENT
- INCREMENTAL CONVERSIONS
- INCREMENTAL CONVERSION RATIO
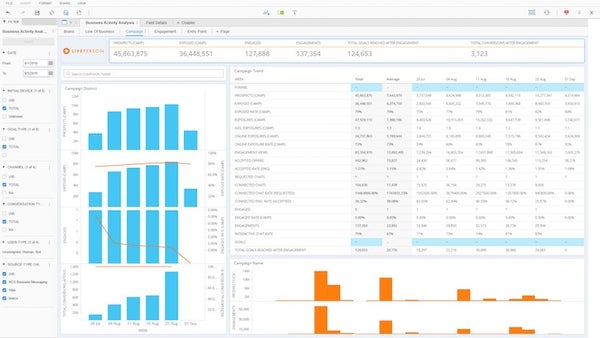
Common to LoB, campaign, entry point and engagement panels
In order to isolate filtering by a specific object name to a single panel without influencing the other panels, a search box has been added to each panel. Searching and selecting one or more Lines of Business, Campaigns, Engagements, or Entry Points (each in their respective panel), will filter all the visualizations in the panel. This will allow drill down to the performance of a designated group of object (for example: all Sales related LoBs).
Each panel, in the bottom area, includes the general volume generated by each LoB, Campaign, or Engagement.
| Graph Name (Type) | Vertical (Metrics) | Horizontal (Attributes) |
| [Object] Name(bar chart) | PROSPECTS, ENGAGENENTS | LINE OF BUSINESS / CAMPAIGN / ENGAGEMENT |
Site panel
The site level analysis adds to the top of the funnel an overview of web-traffic including the following additions.
| Graph Name (Type) | Vertical (Metrics) | Horizontal (Attributes) |
| Prospects | PROSPECT RATE(line chart - secondary axis) | WEEK |
Top data bar (Grid)
Columns (Metrics):
- SESSIONS
- LOGGED IN TIME
Site Trend (Grid)
Columns (Metrics):
Funnel metrics
- SESSIONS
Operational metrics
- LOGGED IN TIME
- AWAY TOTAL NOT ENG.
- AWAT TOTAL NO ENG. RATE
- LABOR TIME
- AWAY TOTAL ENG.
- AWAY TOTAL ENG. RATE
- ENGAGED TIME
- ENGAGED TIME RATE
- OCCUPANCY RATE
- CONC. ENGAGED
- CONC. LABOR
Engagement panel
Included in this panel is an engagement formats selector, allowing the filtering of all data presented in this panel by the format as set up in the engagement entity in the campaign module.
Supported formats include:
- Embedded
- Sticky
- Overlay
- Toaster
- Slide-out
- Peeling corner
Business activity engagement analysis
Entry point panel
The Entry Point is a section on your website or mobile app. On each entry point, setup in a Campaign, consumers are targeted and engaged. As your Conversational Cloud implementation grows, consumers arriving to an Entry Point may be targeted by several campaigns, effectively competing with each other towards the same or even different business goals.
Use the Business Activity by Entry Point to analyze the traffic on each website section or mobile app section. Are your campaigns covering all the visit sessions to this entry point? Are prospects being offered an engagement. Take the opportunity to optimize your targeting and engage with enough and the right consumers.
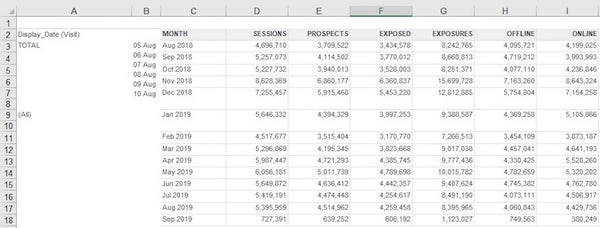
Business activity grid
The business activity grid spreads out all the funnel metrics in a granular view so any member on the account may receive scheduled copies to their email.
Perform the analysis and customization you need using an offline copy, in excel using the complete business activity grid. You can choose the document type (daily/monthly) based on your needed timeframe. The daily grid gives daily aggregations for all the metrics while the monthly grid offers the corresponding aggregations at the monthly level. The data is presented at the brand, campaign and engagement level.
Please note: The business dashboard for messaging does not include agent level data or responses to surveys.
For all metrics available within this dashboard please search the Analytics Builder Data Metrics by the name of the dashboard here
Missing Something?
Check out our Developer Center for more in-depth documentation. Please share your documentation feedback with us using the feedback button. We'd be happy to hear from you.