Using the MCS Toolkit
Main dashboard
The main dashboard displays key MCS data for each agent via the Agent Scorecard, as well as additional insights from various widgets. The burger menu to the top right allows the user to switch between chat and messaging data.
Agent scorecard

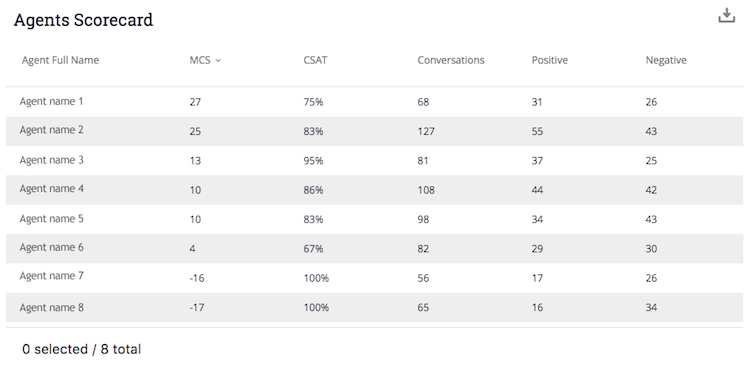
The scorecard displays a list of all agents and the following information:
- Agent MCS
- Average CSAT
- Number of conversations
- Number of negative conversations
- Number of positive conversations
The scorecard allows the user to order the agents based on their MCS. By clicking on one of the agent names, the user navigates to the conversations page, and the agent name is automatically added as a filter.
Data from the scorecard can also be exported to CSV.
Agent MCS Health

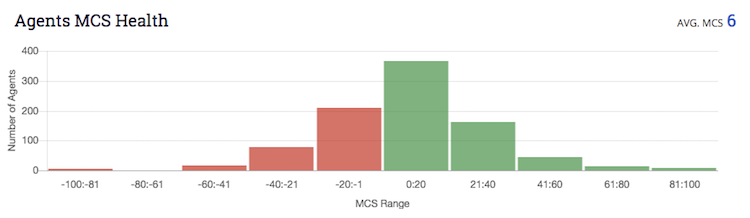
This widget displays the distribution of agent MCS, offering an overview of the performance of all agents on the account. Users can benchmark an agent’s performance against that of his peers, enabling agent managers to easily assess how well an agent is performing in comparison to the rest of his group or subgroup.
By selecting other filters, this widget can also indicate average MCS by other parameters, such as brand or agent group.
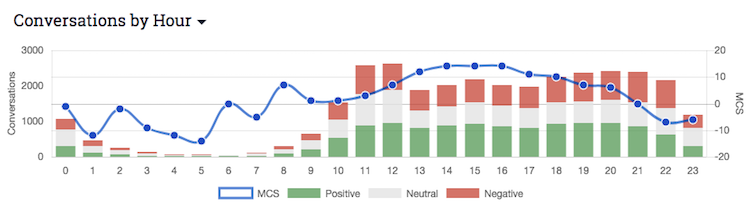
Conversations by date
This widget allows the user to identify changes to the MCS trend, by displaying the total volume of conversations, as well as the total number of each conversations rated positive (0<), negative (0>) and neutral (0) by MCS over time. The line indicates the average MCS per time period, which can be configured to display a variety of time slots, such as by hour, by month or by a specific date.

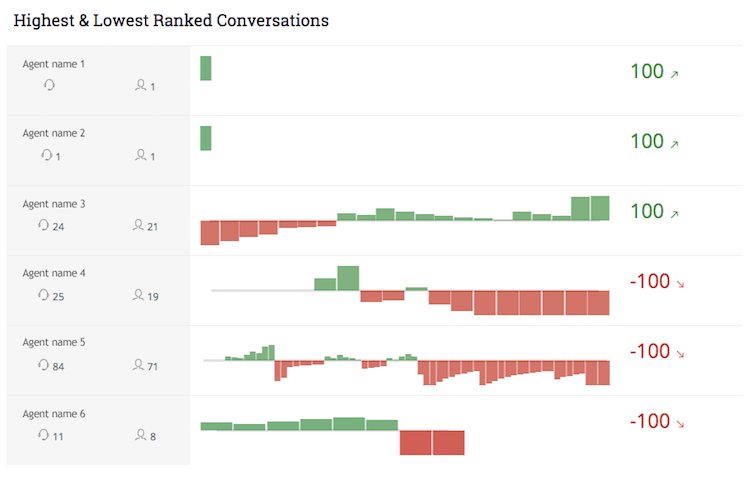
Highest & lowest ranked conversations
To give users a snapshot of the MCS highs and lows on their account, or within their agent groups, the three best and three worst ranked conversations are displayed. This provides users with an instant view of the outlying conversations, which tend to be the most useful in terms of learnings and analysis.
As well as indicating how the MCS for each conversation has evolved over time, the name of the agent, the number of agent messages and the number of consumer messages are also displayed.

Conversations
The conversations page displays all conversations according to the applied filters. The columns displayed are as follows:
- Start - The time the visitor first started a conversation with the agent (displayed in the MCS Toolkit user’s local time), or the time the agent resumed the conversation with the consumer (start and end times are also provided by UTC time via the CSV export function).
- Duration (mins) - The time frame between when the consumer started the conversation until it was ended by either the consumer or the agent.
- **MCS - The Meaningful Conversation Score. For further information on how the MCS is calculated, refer to the Meaningful Conversation Score overview.
- MCS trend - An indication of how the consumer sentiment changed from the beginning to the end of the conversation - for example, if a conversation began at -50 MCS, but ended at 100 MCS, the trend is +150 and indicates a strong improvement in consumer sentiment and the perception of the brand.
- CSAT (messaging conversations only) - The customer satisfaction score, calculated from post-conversation survey data, reflects the consumers’ rating of a brand’s engagement with them.
- Agent - The name of the latest agent assigned to the conversation. Due to the continuous nature of messaging conversations, it is likely that more than one agent had been active in conversation with the consumer over time. The full list of participants in the conversation can be viewed by clicking on the conversation, or via the CSV export function.
- Skill - The latest skill assigned to the conversation.
- Group - The latest Agent Group that the agent(s) assigned to the conversation belong to.
- First (messaging conversations only) - This column indicates if it is the first time the consumer has contacted with the brand.
- Device - The device the consumer started the conversation from.
- TTFR (min) - Time to First Response, the time between the consumer’s first message and the agent’s first response.
- Response time (min) - The average response time between the agent and consumer during the conversation.
- Agent messages - The number of messages sent by the agent during a conversation.
- Consumer messages - The number of messages sent by the consumer during a conversation.
Users can apply the sort filters in order to focus on certain conversations, or types of conversations. For example, sorting by MCS allows users to quickly see the highest and lowest ranked conversations, while sorting by TTFR enables users to see the impact of a long (or short) TTFR on the MCS.
Conversation breakdown
In-depth analysis of the MCS data for each conversation is provided on this view, providing users with insight into the fluctuations in MCS during a conversation, and understand why these changes occurred.
Conversation details

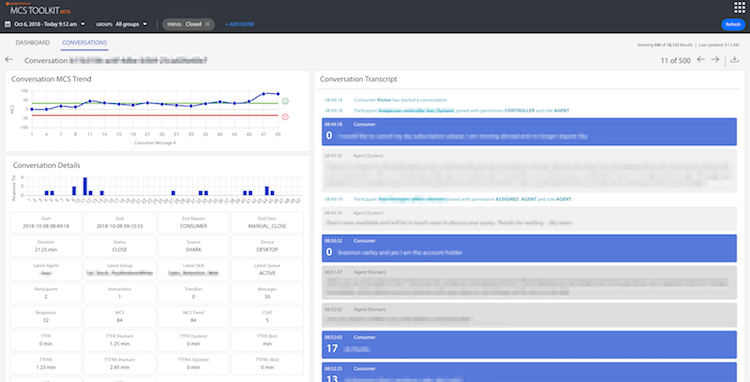
Key information about each conversation is displayed as follows:
- Start
- Agent
- Group
- Skill
- Duration
- MCS
- CSAT
Conversation MCS trend

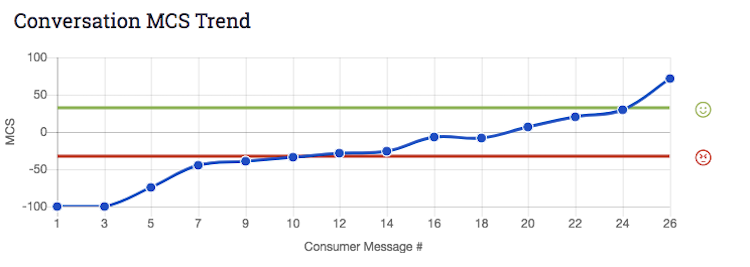
This visualization presents the MCS trend for the duration of the conversation. For ease of navigation, when the user clicks on a data point on the graph, the corresponding message in the conversation transcript will be highlighted, allowing the user to instantly see the content of the message that triggered the MCS.
The visualization also displays the threshold alerts for positive and negative MCS (<-33 for negative MCS and > 33 for positive).
Conversation KPIs

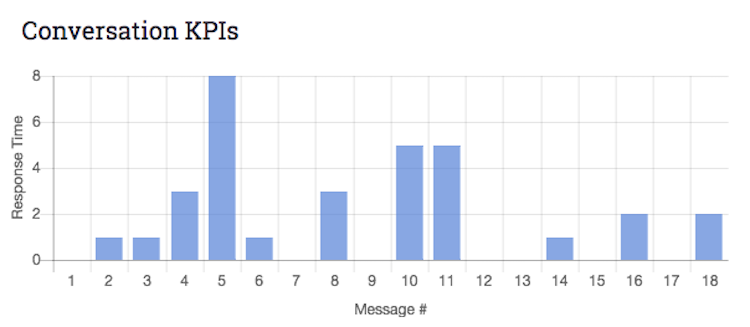
This widget displays the response time in minutes per message, allowing users to draw conclusions as to the impact of the response time on the MCS of a conversation.
Conversation transcript
The transcript shows every message in the conversation, along with the corresponding MCS. The transcript view can be changed to display consumer messages only and can then be filtered by positive or negative messages; or to display agent messages only.
To identify exactly why the MCS rose or dropped during a conversation, users can click on the data points in the Trend widget and then review the specific point in the transcript that the score was impacted.
Filters
The MCS toolkit is pre-filtered, meaning data is displayed according to the permissions of the user. For example, agent managers are only able to see data for the groups and subgroups that they manage.

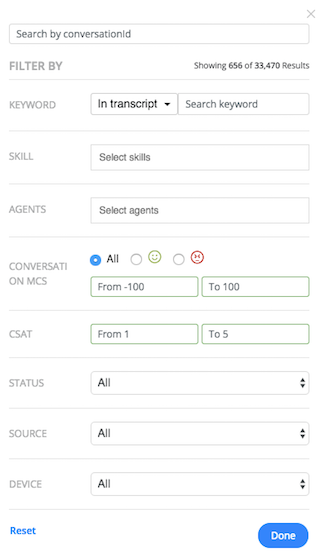
The dashboard can be filtered by the following parameters:
- Date/time period
- Groups
- Keyword
- Skill
- Agent
- MCS
- CSAT (messaging mode only)
- Status (open/closed) (messaging mode only)
- Source e.g. app, web, Facebook (messaging mode only)
- Device (messaging mode only)
- Interactions (chat mode only)
In addition, to find data for a specific conversation, users can search by conversation ID. The dashboard will then display only data for that conversation (if available).
When filters are selected, the page will load data according to the filters. When filters are then added or removed, users must click the refresh button in order to pull additional data.
Languages
Currently, MCS is available in the following languages: English, Spanish, Japanese and Italian
Missing Something?
Check out our Developer Center for more in-depth documentation. Please share your documentation feedback with us using the feedback button. We'd be happy to hear from you.